|
Time series of validation results for sea ice
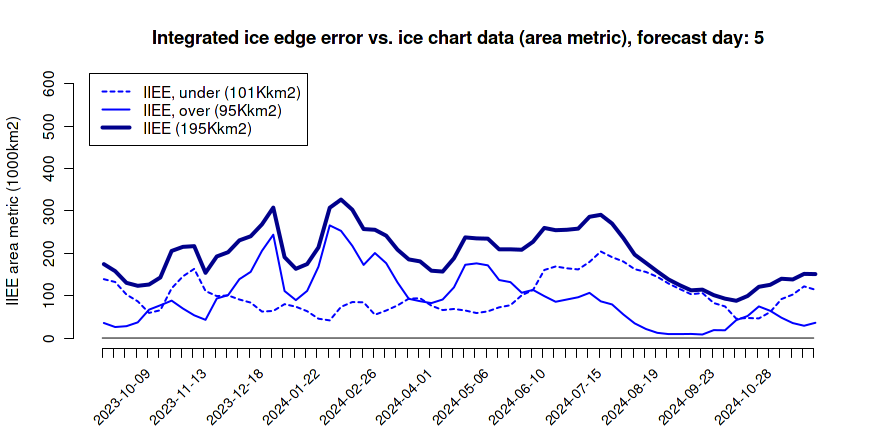
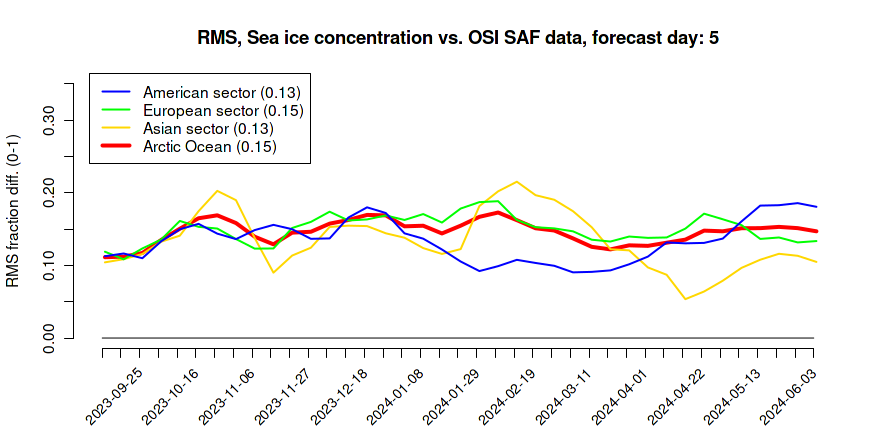
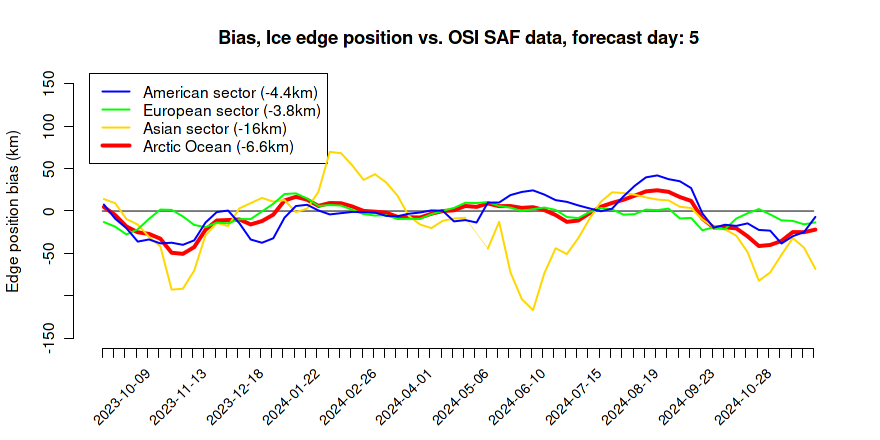
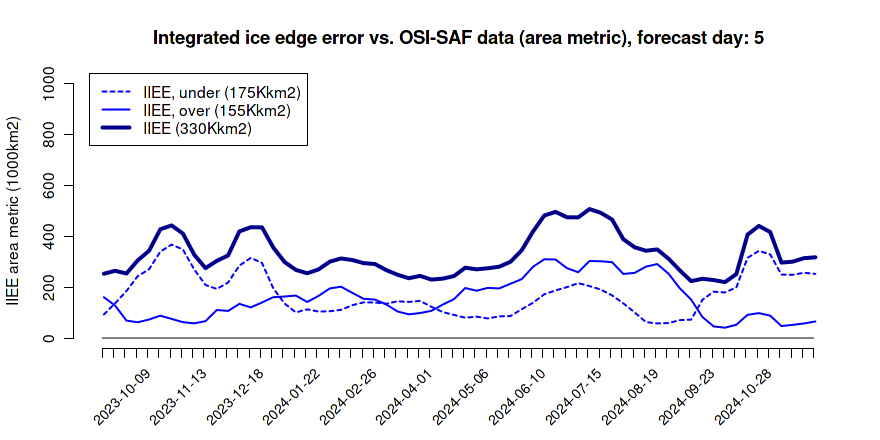
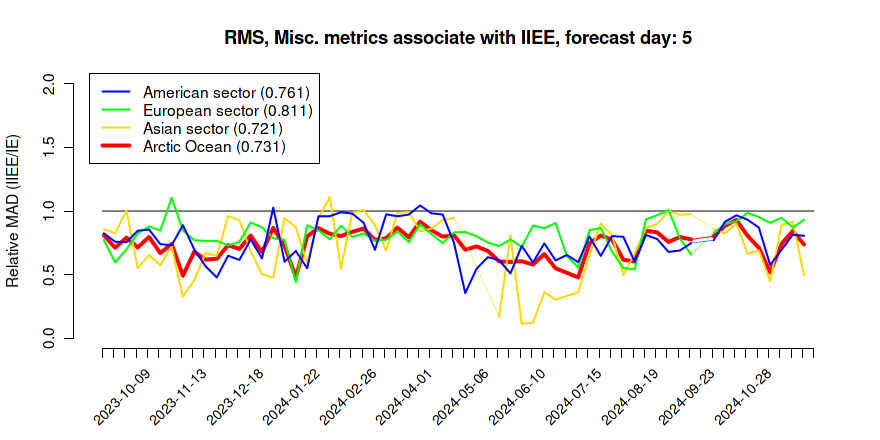
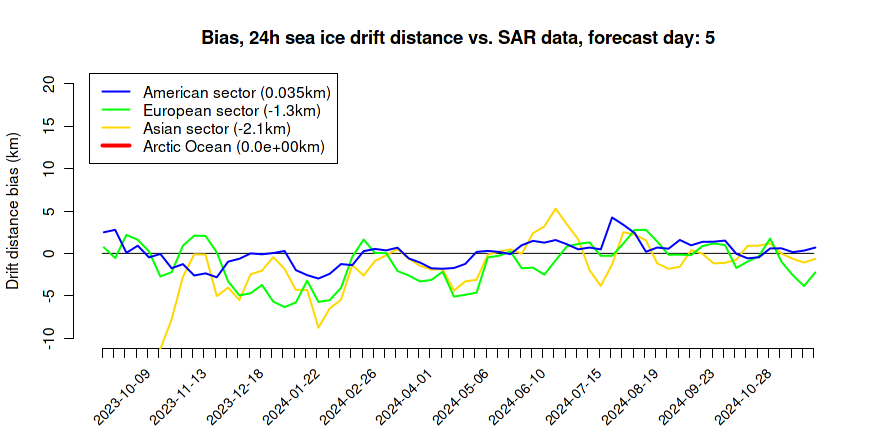
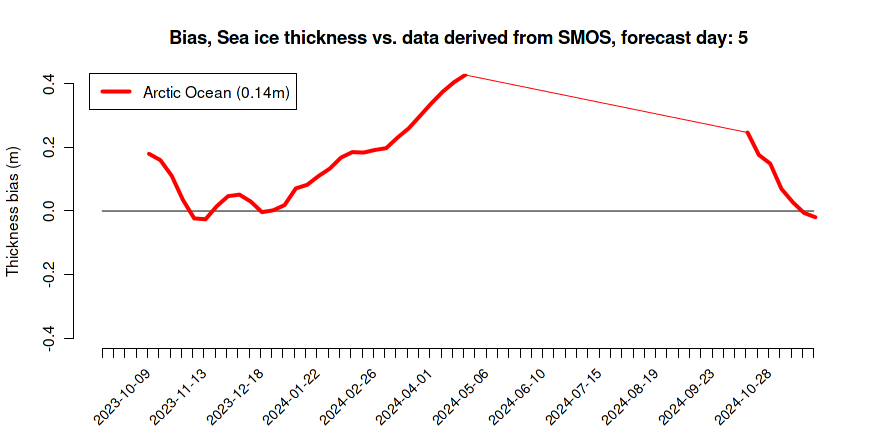
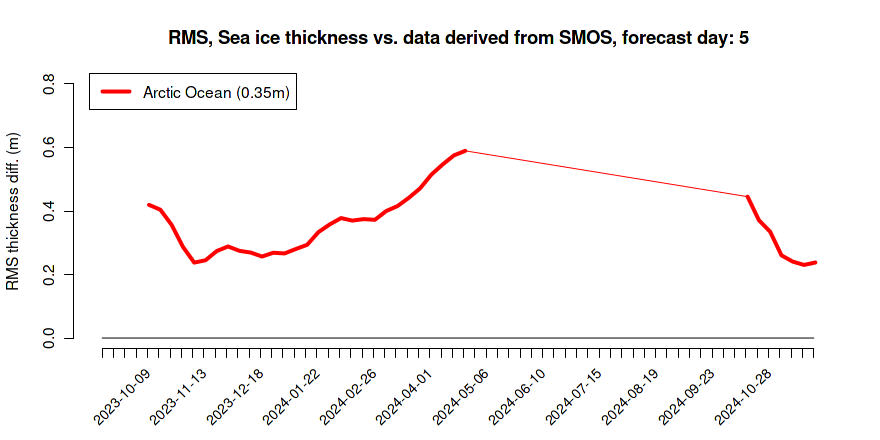
Results below are for the daily average for the 4th day after the day when the bulletin was issued. The bulletin date is given as the x-axis coordinate in the images below. Average values for the time series that are displayed, are given in parenthesis in the line label legend.
The observational product for sea ice concentration/ice edge position of type ice charts is only available for working days. Hence, data are missing for forecast days that correspond to Saturdays and Sundays. Note that the week day of the bulletin may change during the period that is displayed. Due to major changes in the production of metrics, results prior to December 2012 are not shown.
The observational product for sea ice drift is missing in the period 2012-04-08 - 2012-06-17.
Sea ice concentration vs ice charts
Information on validation data, methods, regions, and model results
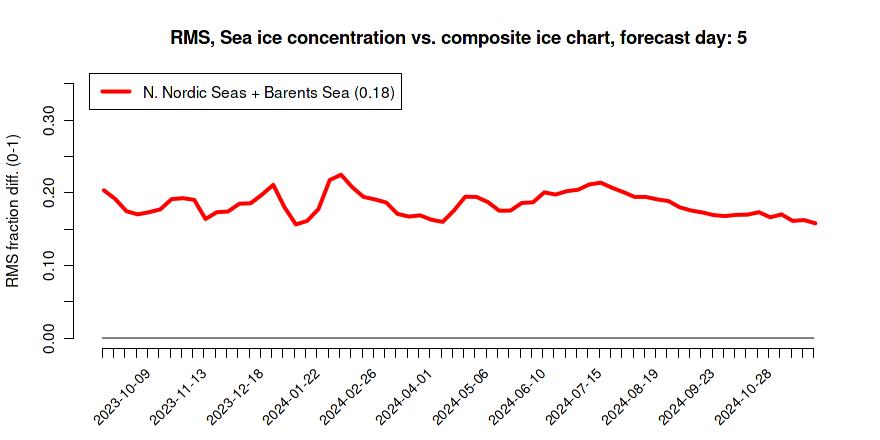
Length of sea ice edge vs ice charts

Ice edge position vs ice charts


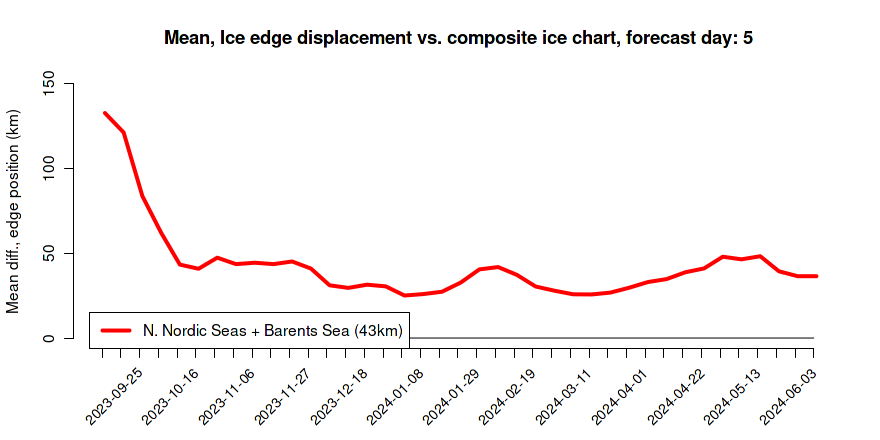
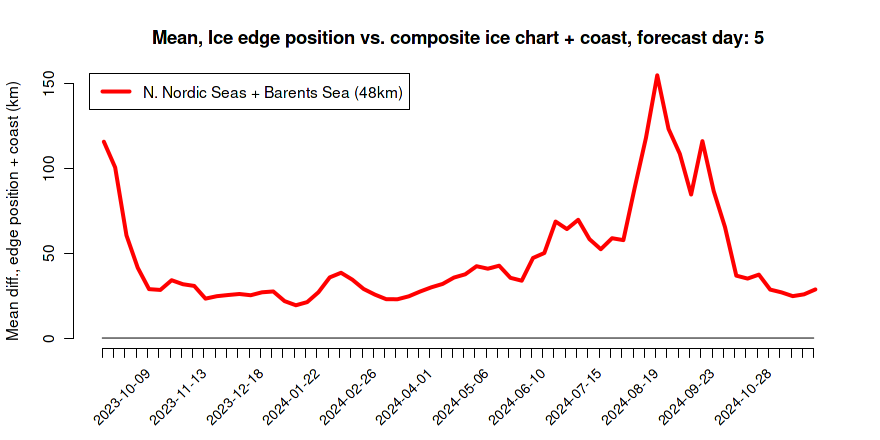
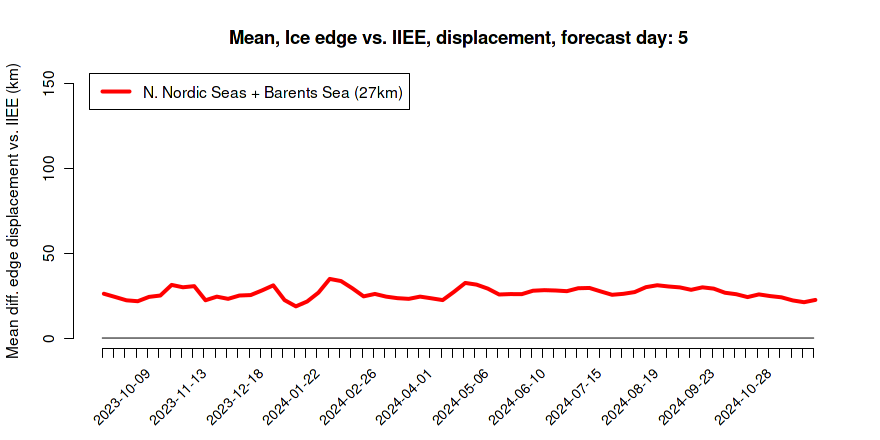

Integrated ice edge error vs ice charts
Sea ice concentration vs OSI SAF
Information on validation data, methods, regions, and model results
Length of sea ice edge vs OSI SAF

Ice edge position vs OSI SAF

Integrated ice edge error vs OSI SAF


Relative MAD of edge position (IIEE/IE) vs OSI SAF
Sea ice drift
Information on validation data, methods, regions, and model results

Sea ice thickness vs SMOS
Information on validation data, methods, regions, and model results
Generated by /metno/routine/sms/V3/timeSeries5/validationTimeSeries5.sh Fri Dec 12 13:37:21 UTC 2025 on arcval2