Copernicus Marine Service Arctic MFC: Validation of sea ice thickness
Validation results: SMOS data for thin sea ice
| January 2025
01-02 01-09 01-16 01-23 01-30 |
February 2025
02-06 02-20 02-27 |
March 2025
03-06 03-13 03-20 03-27 |
April 2025
04-03 04-10 04-17 |
October 2025
10-16 10-23 10-30 |
November 2025
11-06 11-13 11-20 11-27 |
December 2025
12-04 12-11 12-18 |
| January 2024
01-04 01-11 01-18 01-25 |
February 2024
02-01 02-08 02-15 02-22 02-29 |
March 2024
03-07 03-14 03-21 03-28 |
April 2024
04-04 04-11 04-18 |
October 2024
10-10 10-17 10-24 10-31 |
November 2024
11-07 11-14 11-21 11-28 |
December 2024
12-05 12-12 12-19 12-26 |
| October 2023
10-12 10-19 10-26 |
November 2023
11-02 11-09 11-16 11-23 11-30 |
December 2023
12-07 12-14 12-21 12-28 |
Bias is defined as averages of model values - observed values. Additional information is provided under Processing below.
Validation Data: SMOS observations
Validation of the Copernicus Marine ARCMFC results for the thickness of thin sea ice is performed using a dataset which is derived from observations from the Soil Moisture and Ocean Salinity (SMOS) satellite. The sea ice thickness data are produced using an emperical algorithm developed by Tian-Kunze et al.. The algorithm takes advantage of data from the microwave radiometer onboard the SMOS satellite. The operational product has been documented by Kaleschke et al..
SMOS-based results for the thickness of thin ice are available from Alfred Wegener Institute on ftp.awi.de/sea_ice/product/smos/v3.3/nh. SMOS processing was funded by the Support to Science Element Program from ESA.
Processing
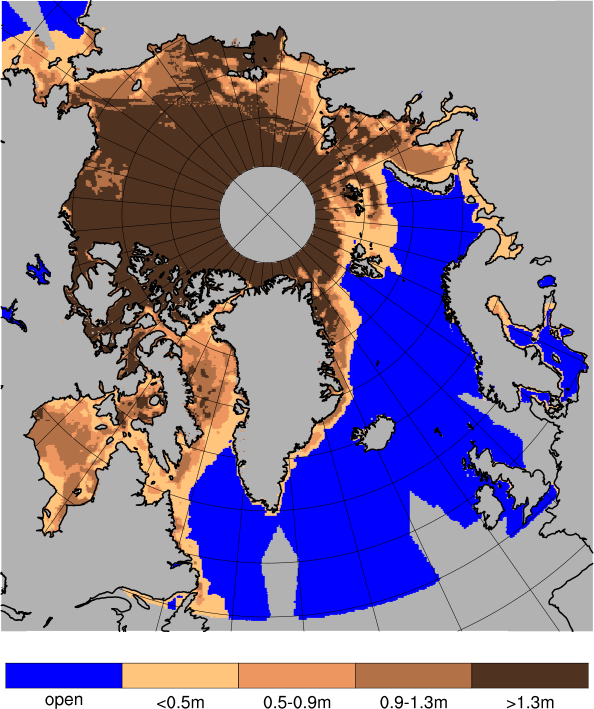
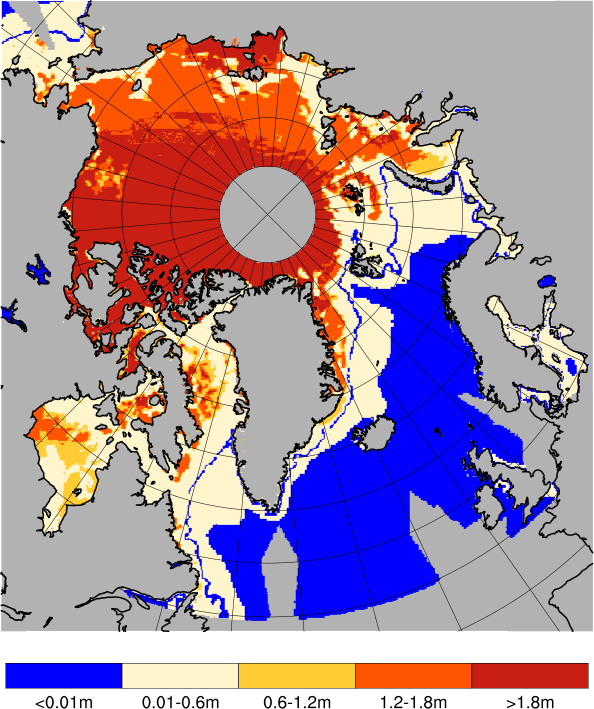
We use results for the sea ice thickness and the uncertainty of these data, derived from the SMOS observations. Samples of these two fields are displayed below.

|

|
| SMOS sea ice thickness on 2017-03-09 | Thickness uncertainty on 2017-03-09 |
Before the comparison of model results and SMOS-based observations is performed, we restrict the validation region by requiring that the uncertainty does not exceed either 1 m or 75% of the seaice thickness (see the description of Data quality on the Sea Ice Thickness from L3C SMOS web page).
Next, the sea ice thickness bias and RMS difference between model results and observations are computed. Finally, the thickness distribution is categorized into pre-defined thickness classes, and the model/observation category match-up is displayed in contingency tables.
Validation results: CryoSat data for thick sea ice
The relevant provision of CryoSat-2 altimetry data for thickness of thin sea ice is undergoing a revision. Awaiting the finalization of the distribution from the new dissemination, this validation has temporarily been discontinued.
Regions

|
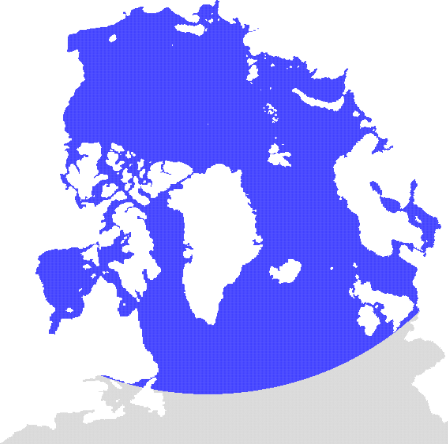
The present version of the coupled sea ice and ocean circulation model used in Copernicus Marine Arctic MFC covers the Arctic Ocean, the North Atlantic Ocean and adjacent ocean regions. The northern part is depicted in the figure to the left. Validation of sea ice thickness from model results is performed for the domain indicated by the blue region in the figure. Note that the actual region for which the validation is performed varies from day to day due to limitations in the geographical coverage, and also due the screening of data resulting from regionally high estimated uncertainty in the observational product. Finally, the temporal observational coverage is restricted seasonally. SMOS data are provided for the freeze-up season since the SMOS data poorly reproduce the sea ice thickness in the melting season. CryoSat data are discontinued during the season when meltponds affect the data. Thus, essentially, both products are available during winter, and not available during summer. |
ARCMFC PHYS (TOPAZ)
The model results are produced with the TOPAZ ocean data assimilation model system. Presently, TOPAZ is run weekly with data assimillation one week prior to the bulletin date, then applying a one-week 100 member ensemble simulation ending on the bulletin date. Then, for each day a 10 day deterministic forecast is produced. TOPAZ was developed and is maintained by the Nansen Center.
ARCMFC PHYS (TOPAZ) results are available as Copernicus Marine product ARCTIC_ANALYSISFORECAST_PHY_002_001 from the Copernicus Marine Data Store. An archive of historical forecasts are available from a thredds server.
