Older SST 0.05° * 0.05°: Validation of Sea Surface Temperature
This page shows results from the latest validation:
Startdate: 2012-11-26 Enddate: 2012-12-03 (Period: 7 days). This validation was performed on Tue Dec 4 14:48:04 UTC 2012
Older validations are found at the bottom of the page.
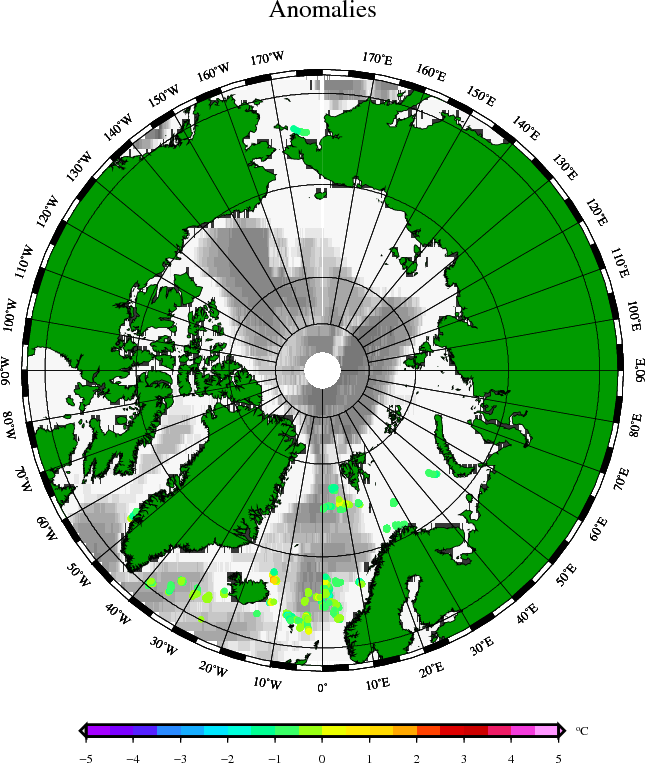
| Anomalies between SST analysis - SST from Coriolis bouys | |
|---|---|
| |
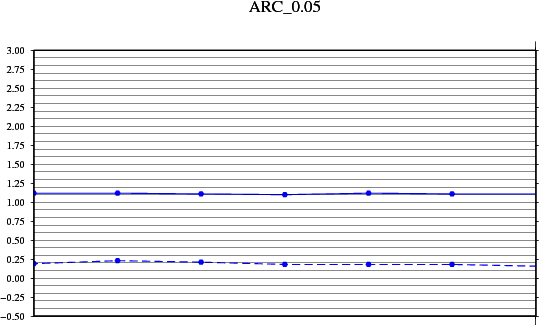
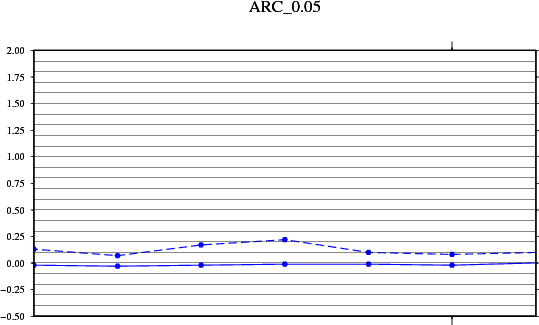
| Error of analysis increment per analysis day of validation period. Mean (solid line) and std. dev. (dashed line). Y-axis: Celcius degrees | Analysis increment (SST analysis - SST 1. guess) per analysis day of validation period. Mean (solid line) and std. dev. (dashed line). Y-axis: Celcius degrees |
| 
|
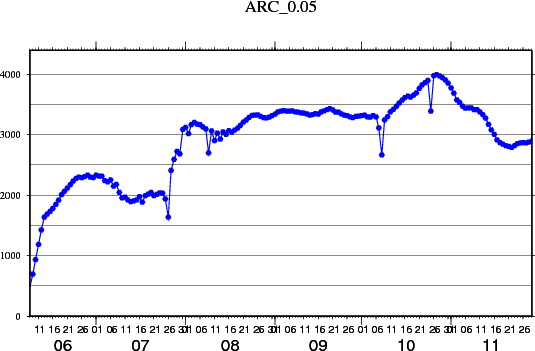
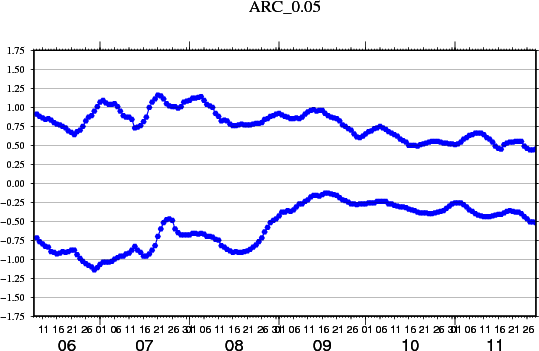
| No of SST anomaly matchup pairs from bouys vs. analysis per validation period. X-axis: Dates refer to center date of validation periods | Average anomalies between (analysis SST) - (Coriolis bouy SST) per validation period.
Mean anomaly (solid line) and std. deviation (dashed line).
X-axis: Dates refer to center date of validation periods. Y-axis: Celcius degrees |
|  |
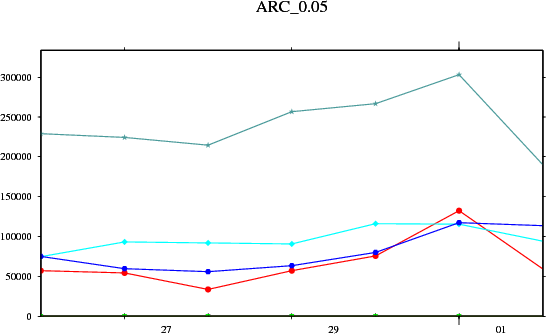
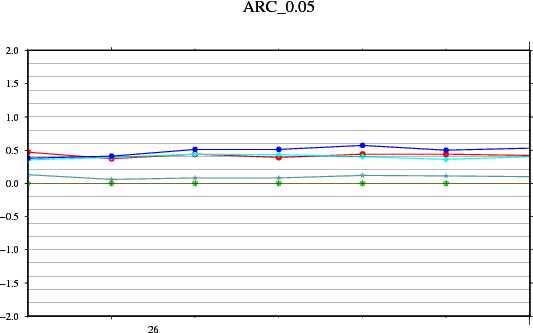
| No of satellite observations per sensor per analysis day of validation period. X-axis: Day of month | Mean anomaly between (sat. obs. SST) - (1. guess SST), per sensor per analysis day of validation period. Y-axis: Celcius degrees |
| 
|
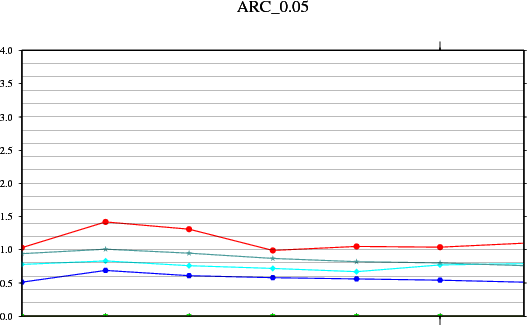
| Std. dev. of anomaly between (sat. obs. SST) - (1. guess SST), per sensor per analysis day of validation period. Y-axis: Celcius degrees | Graph legend, sensors |
|  |