Period 2011 -15 Feb.
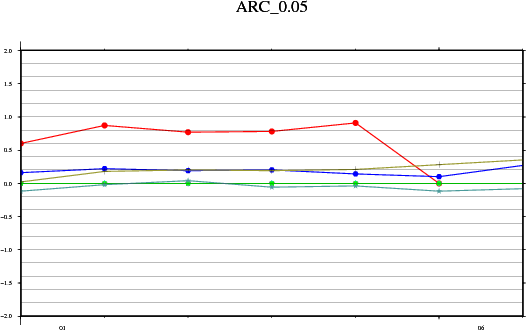
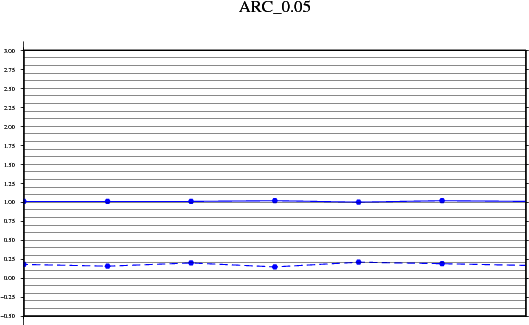
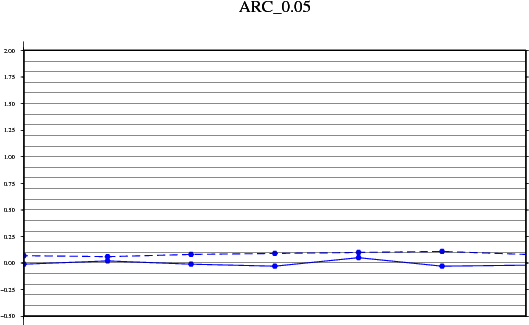
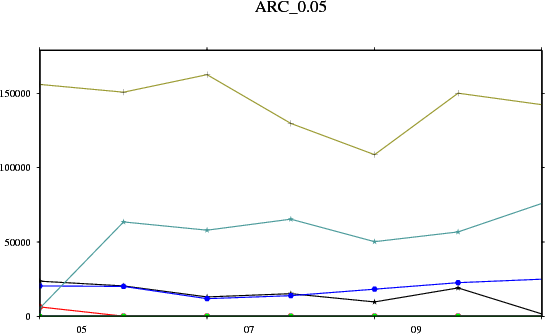
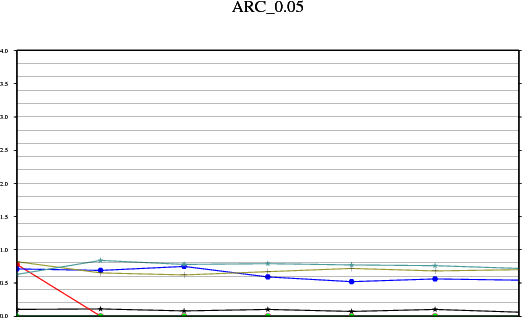
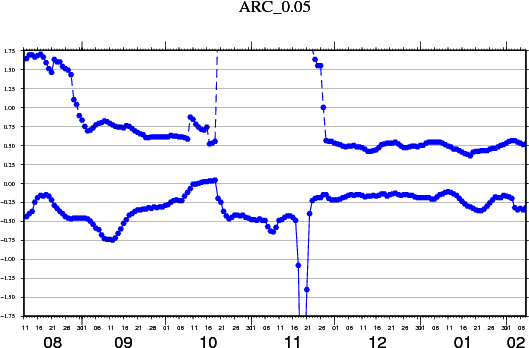
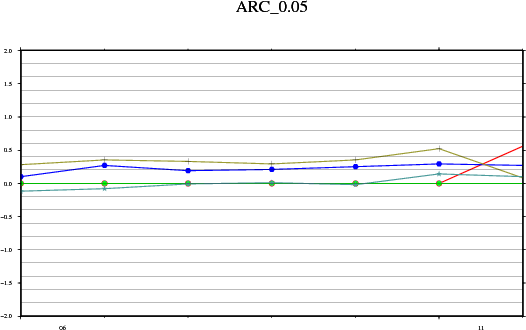
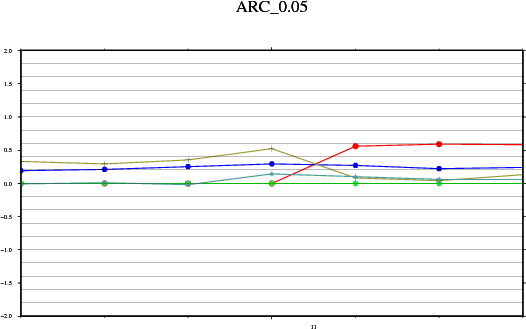
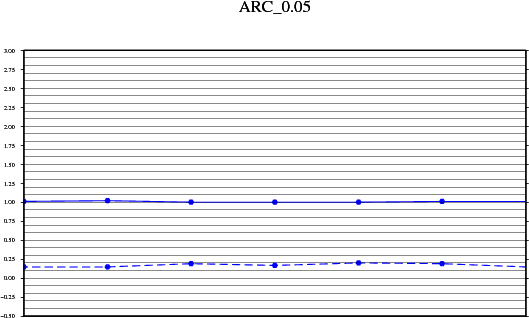
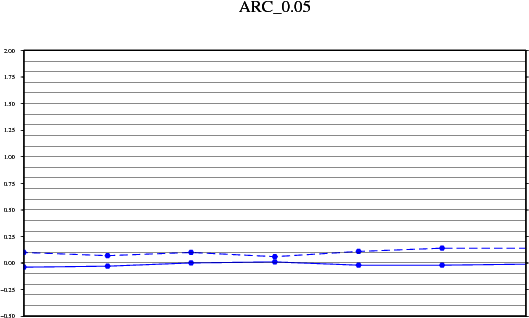
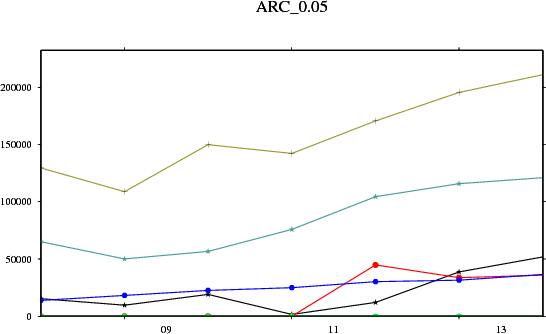
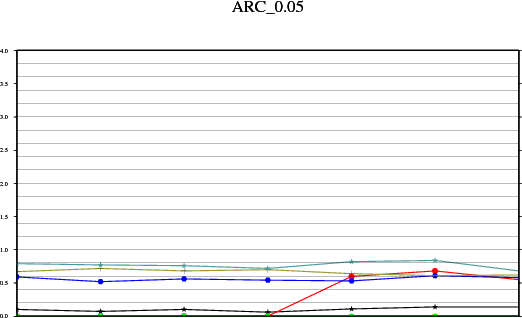
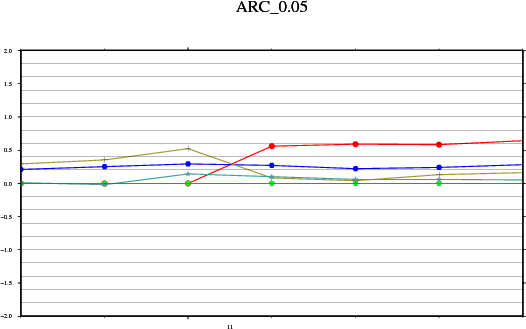
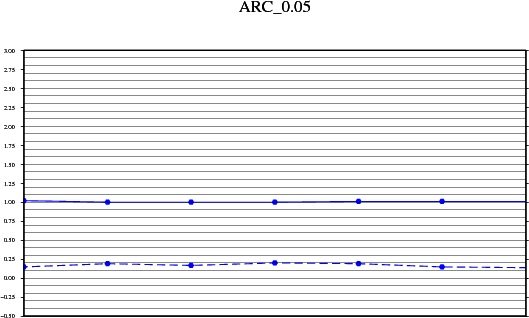
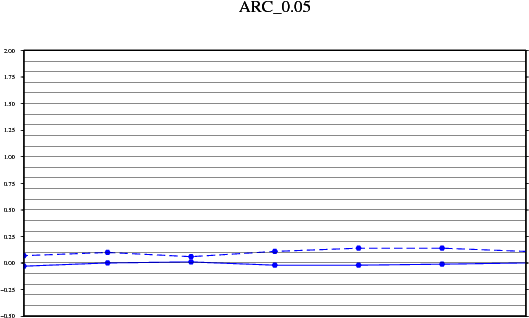
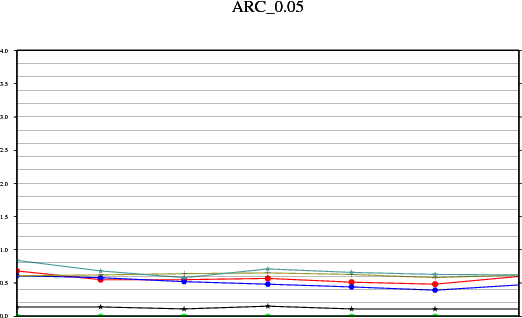
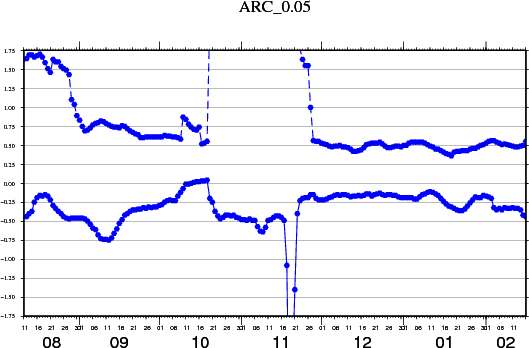
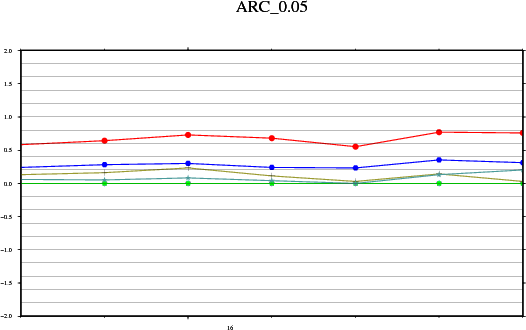
Older SST 0.05° * 0.05°: Analysis of Sea Surface Temperature
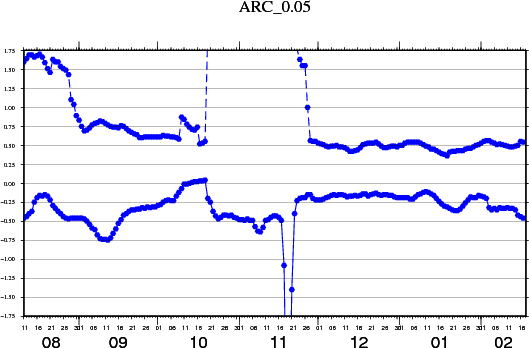
Graph legend: 
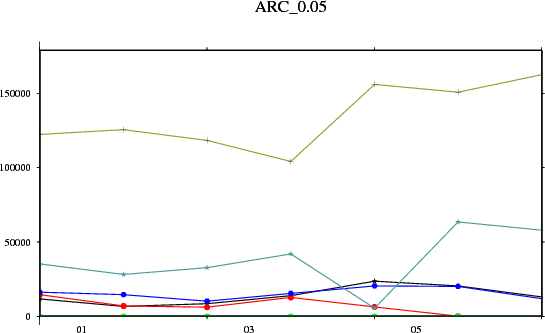
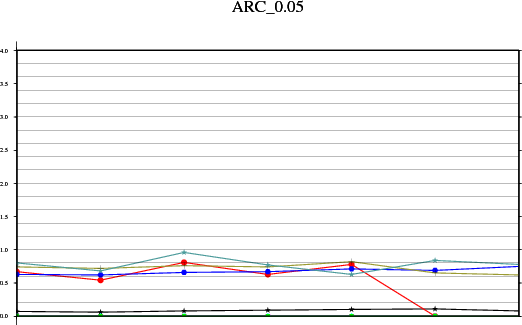
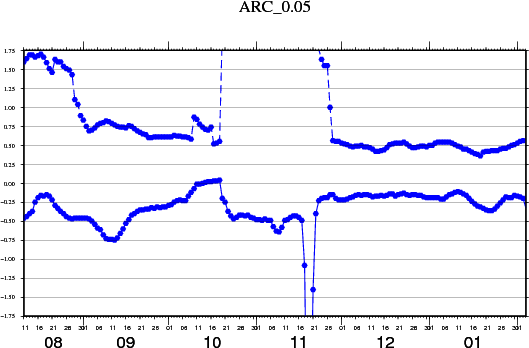
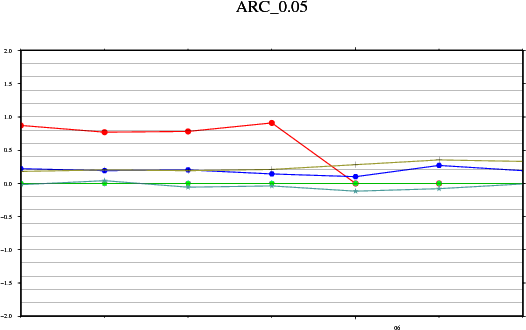
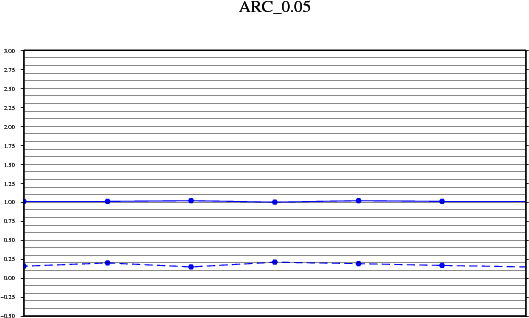
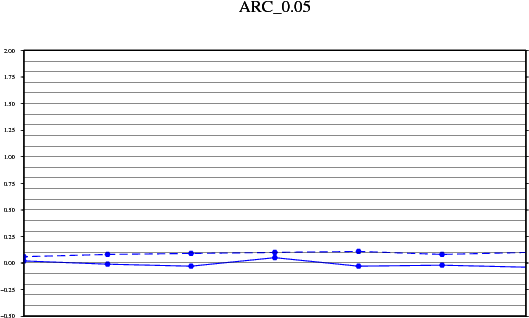
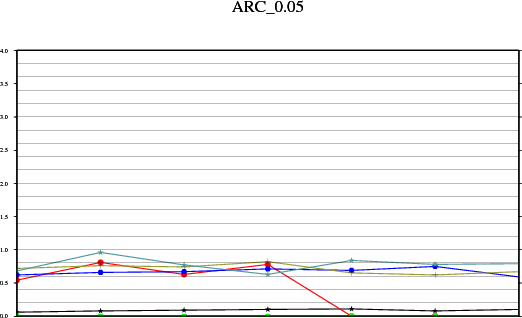
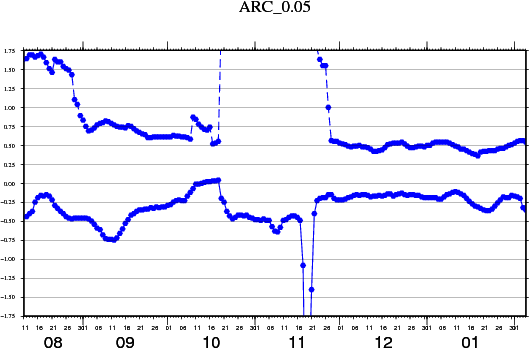
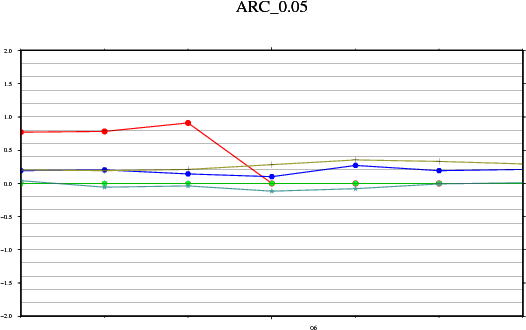
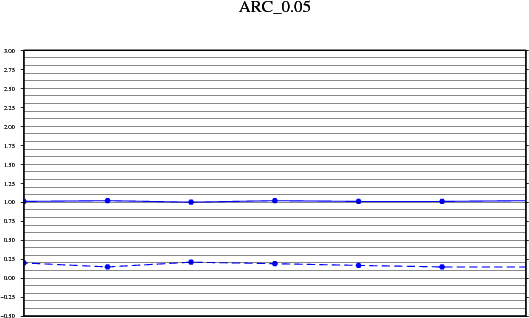
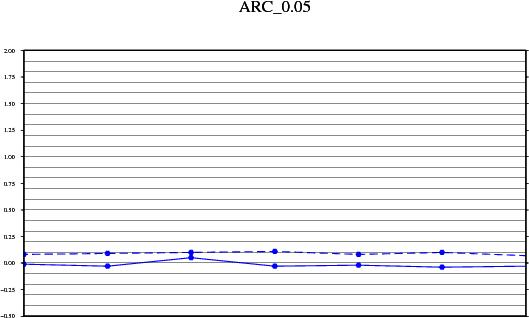
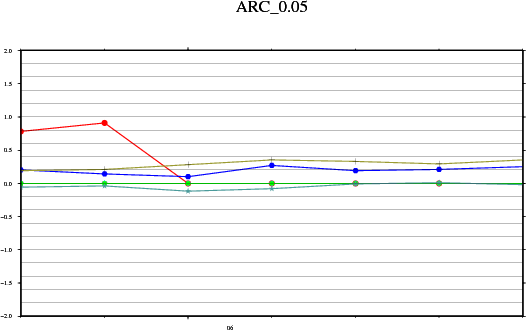
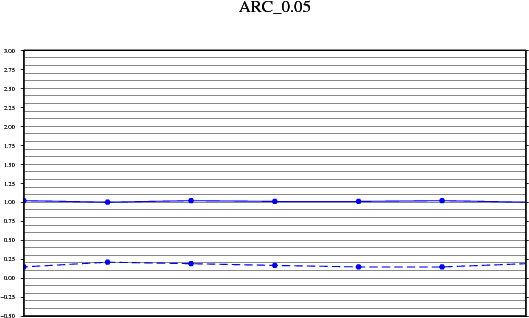
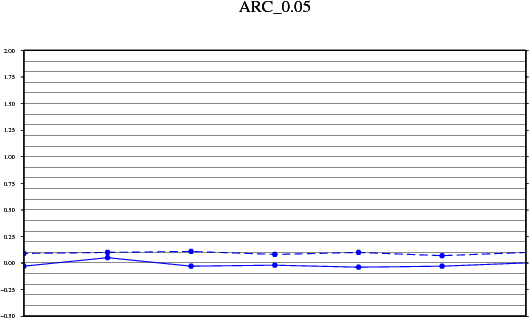
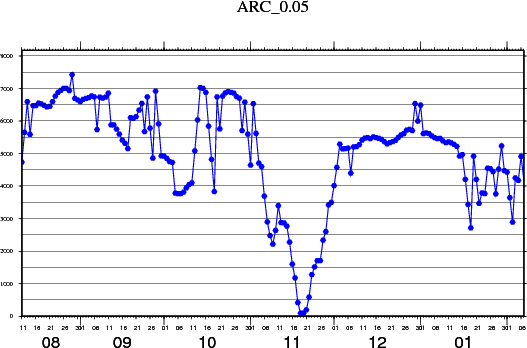
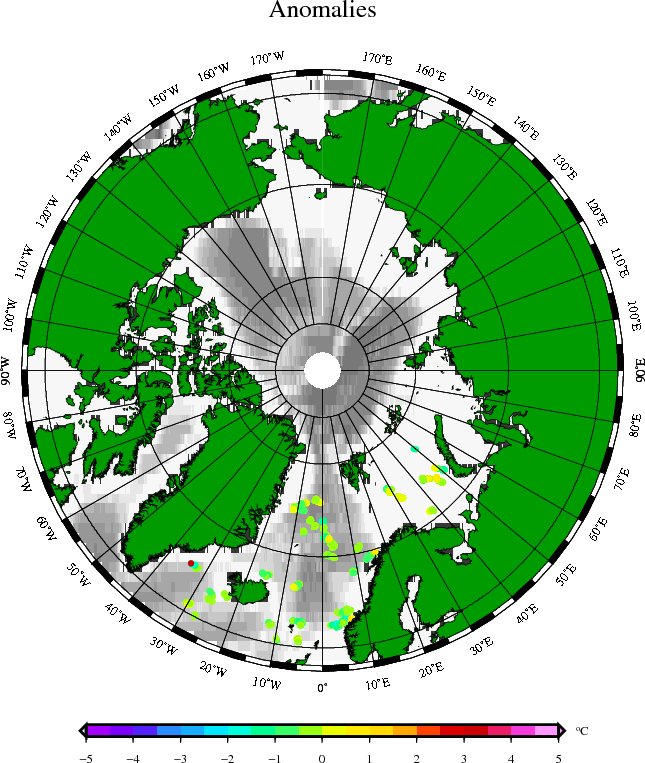
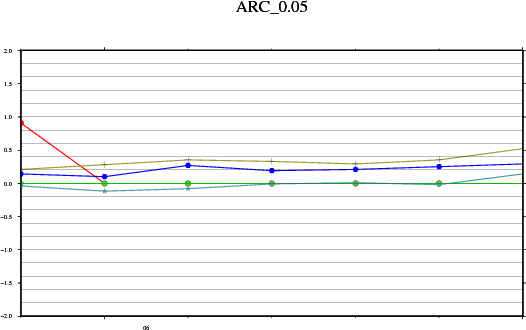
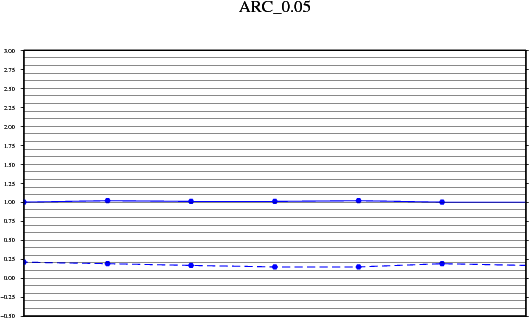
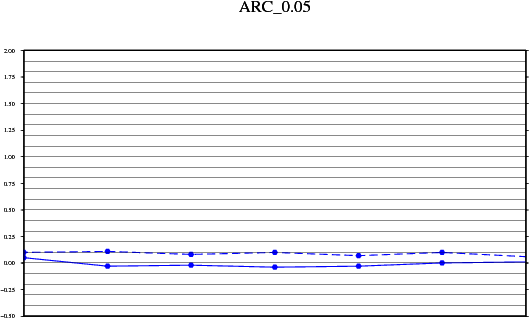
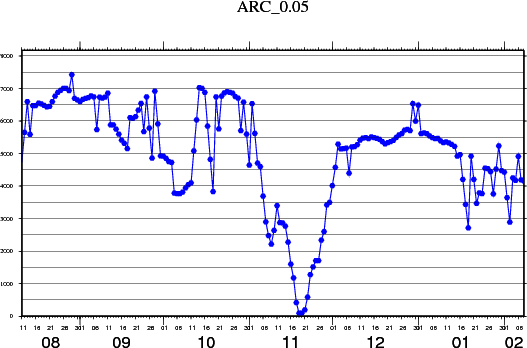
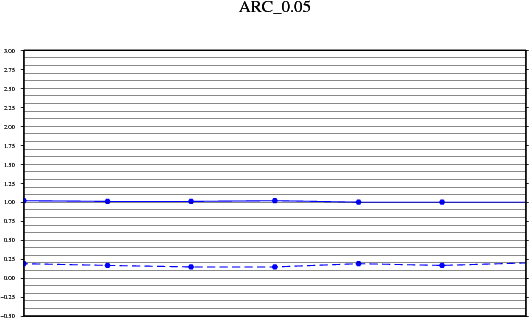
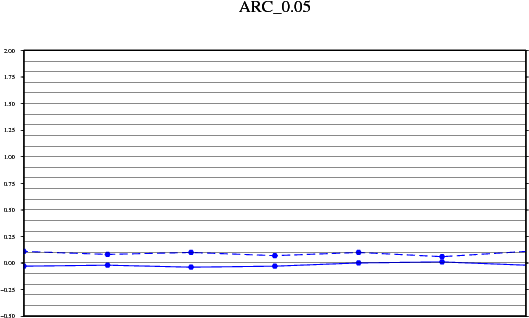
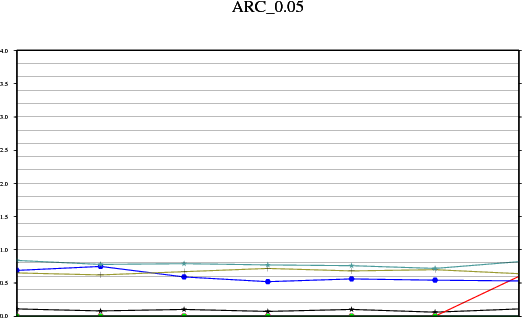
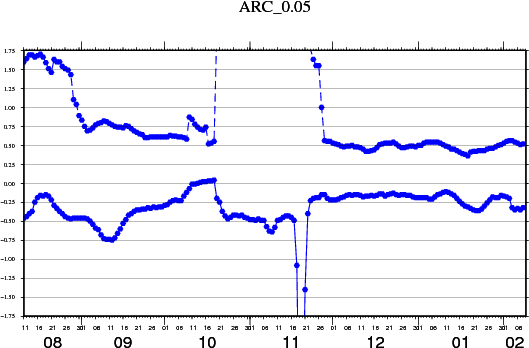
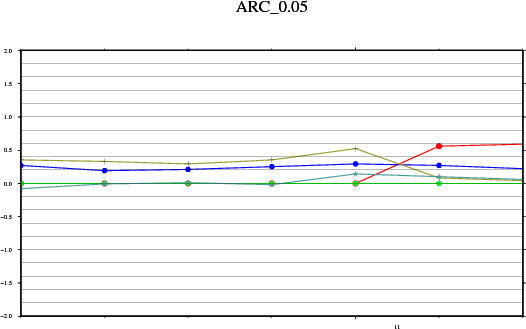
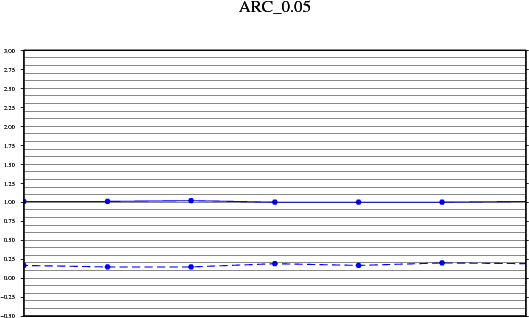
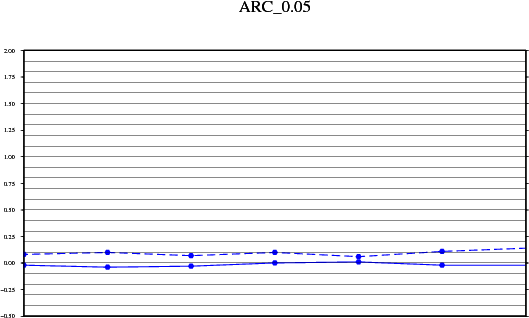
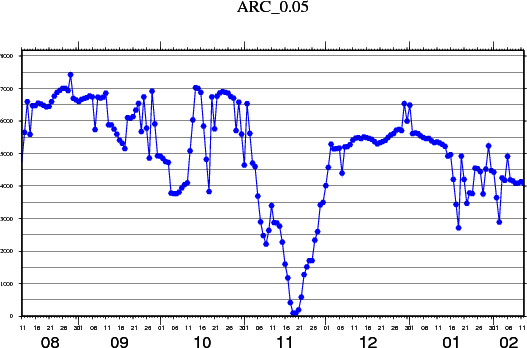
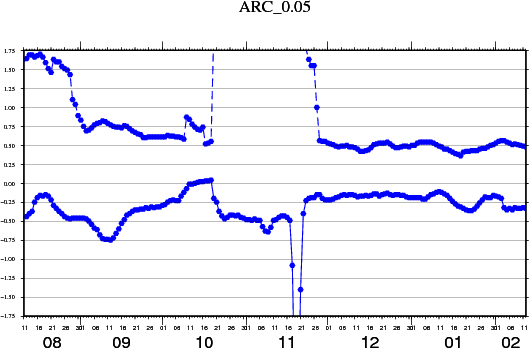
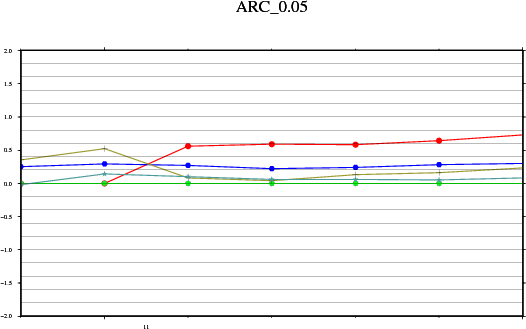
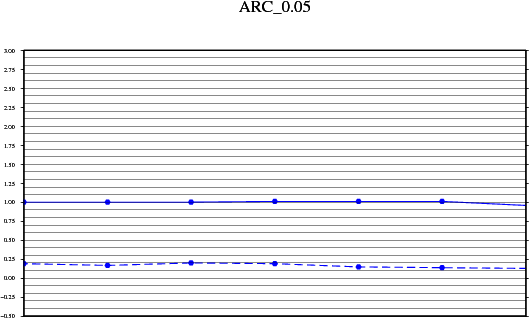
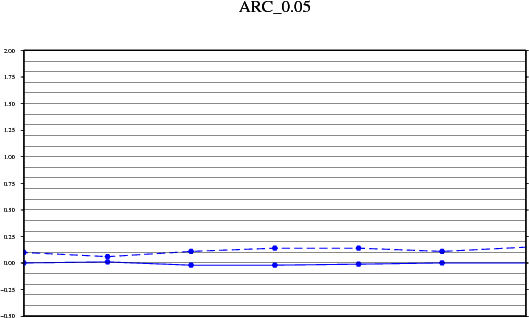
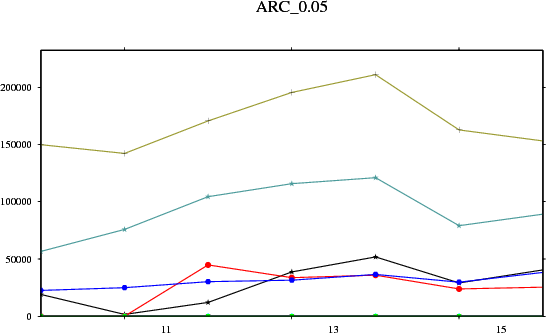
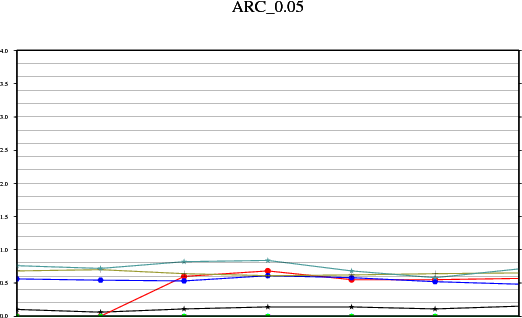
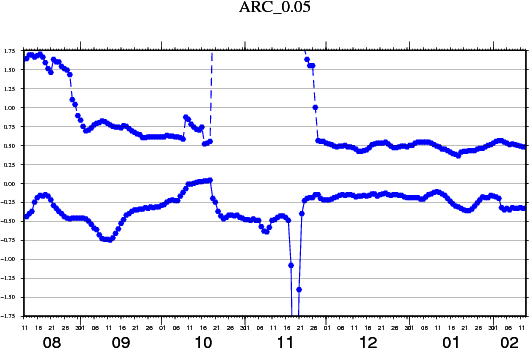
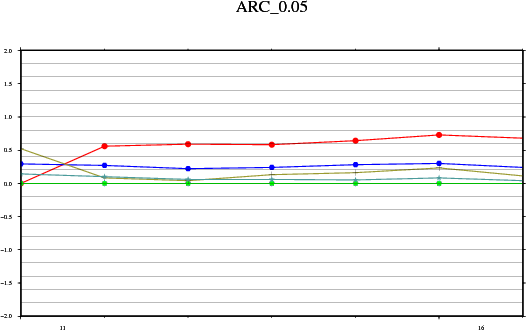
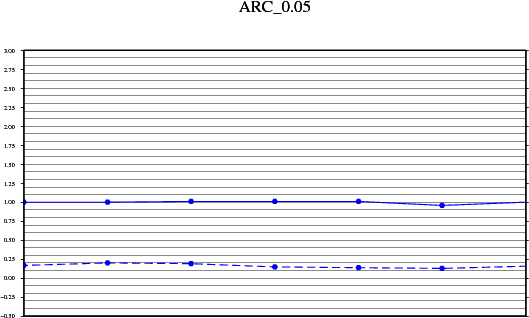
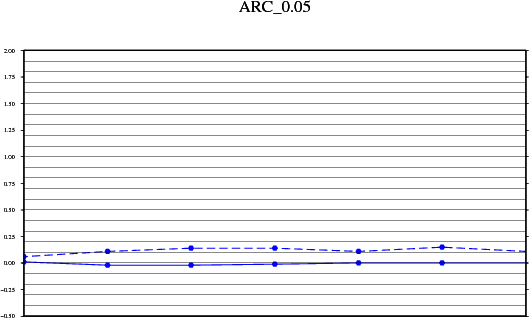
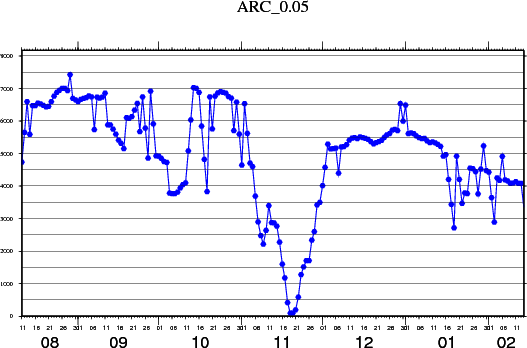
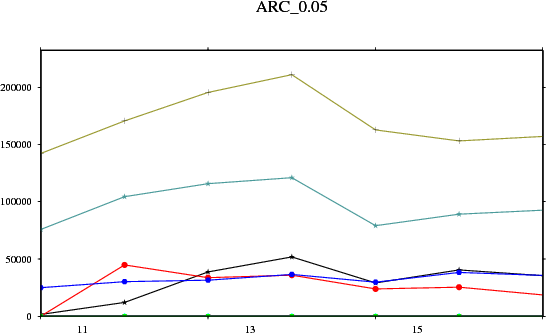
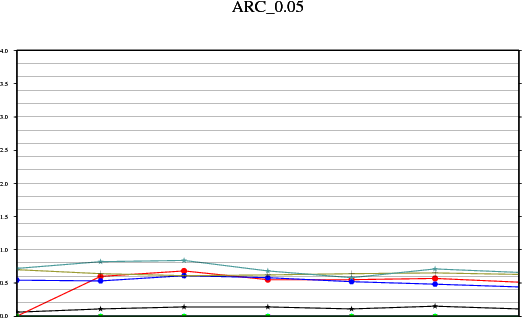
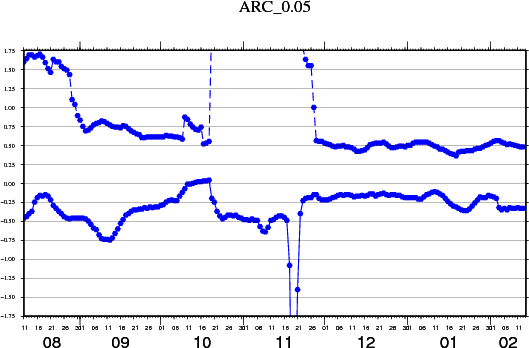
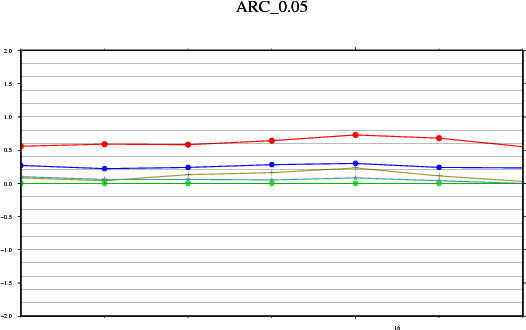
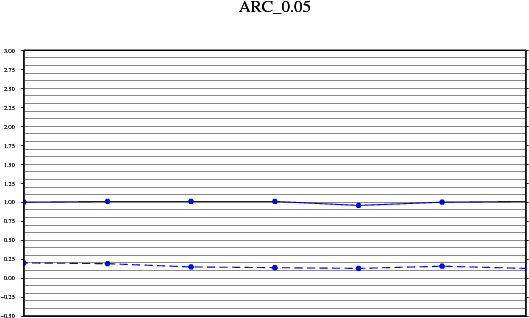
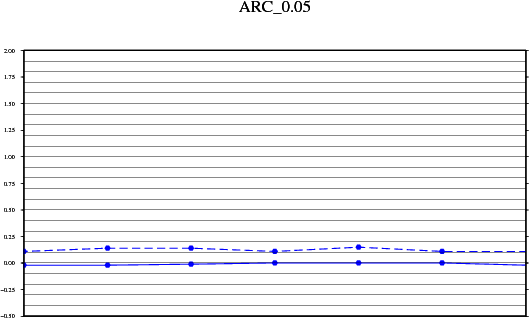
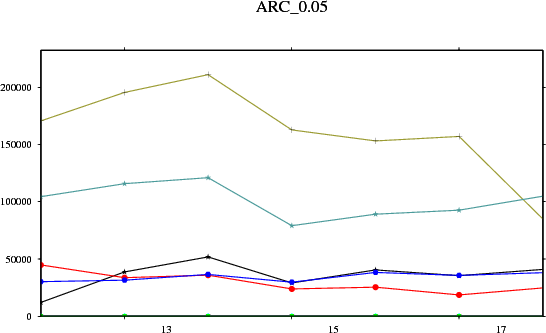
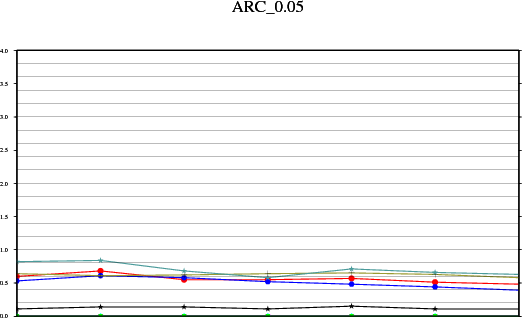
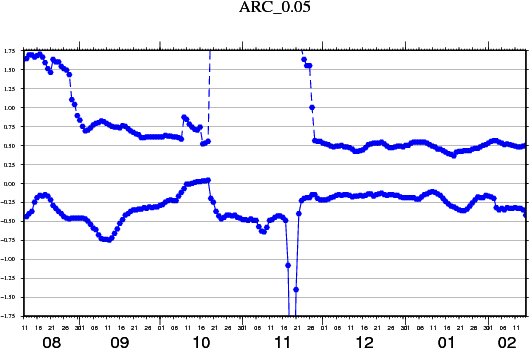
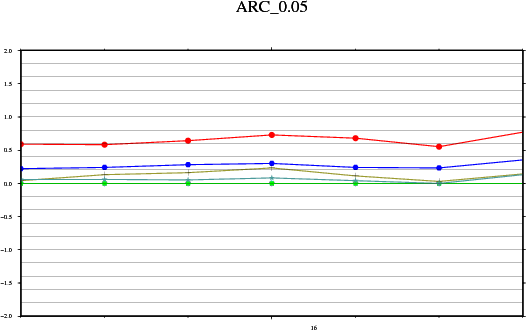
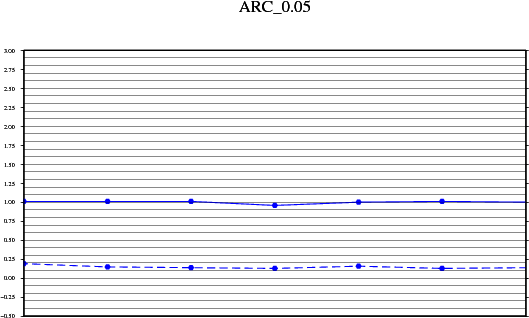
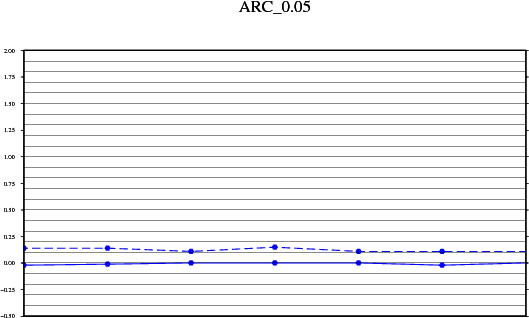
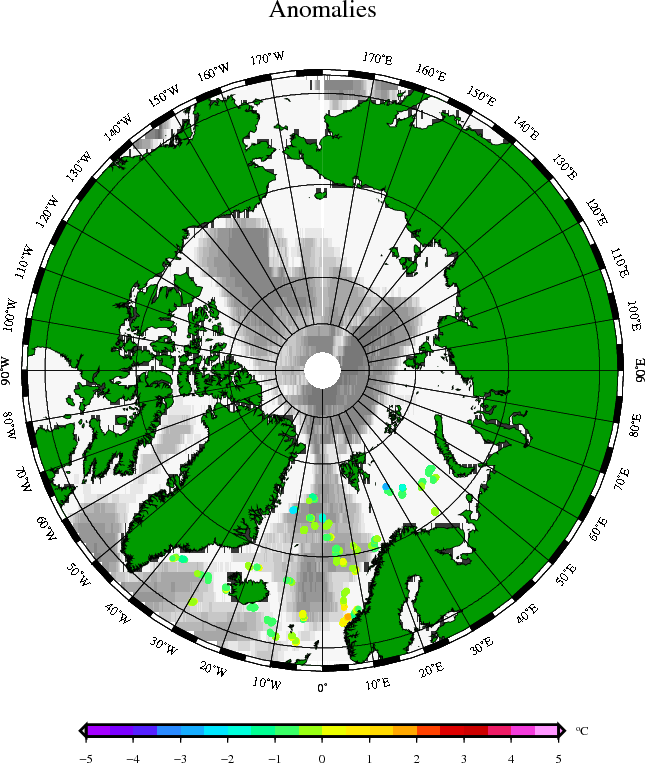
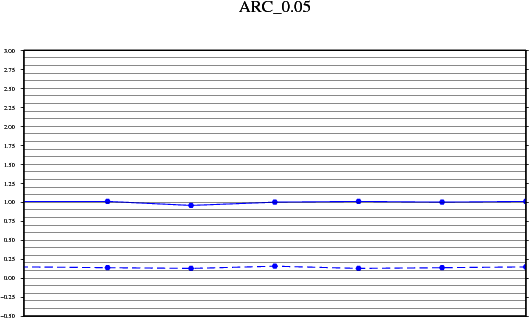
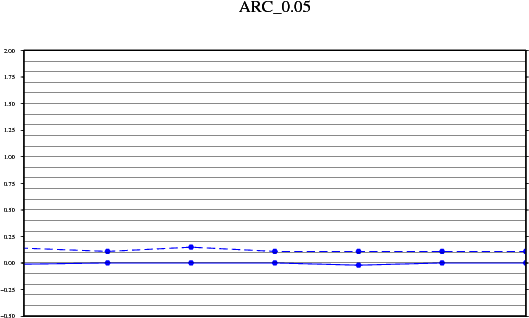
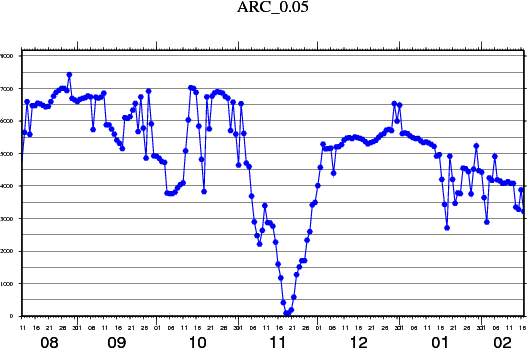
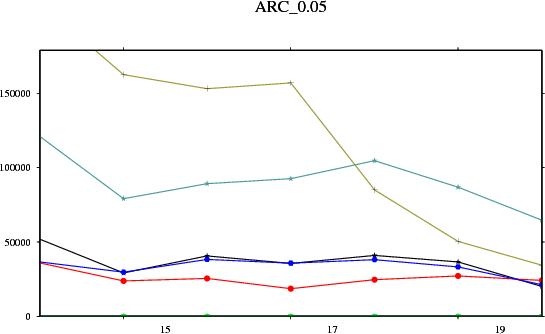
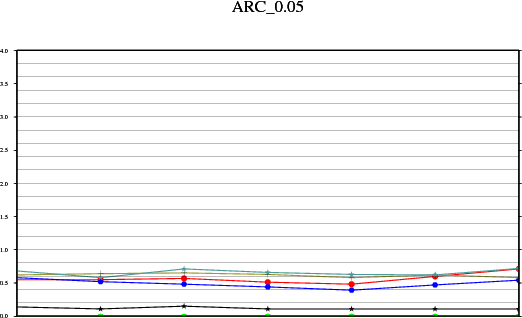
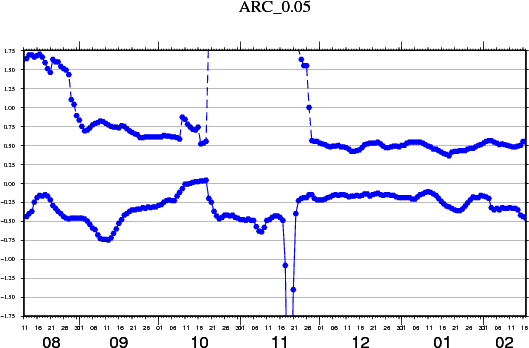
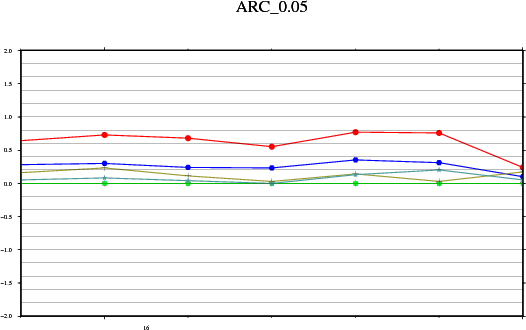
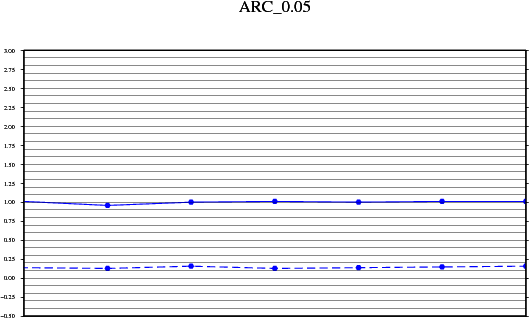
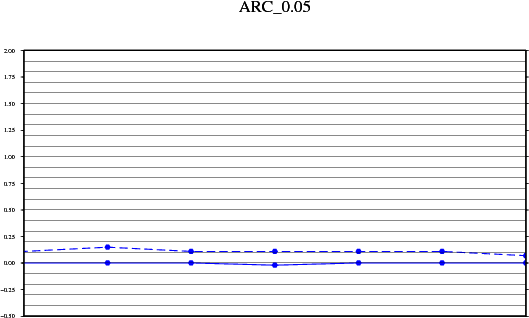
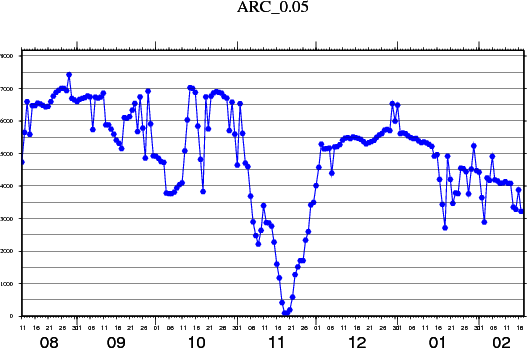
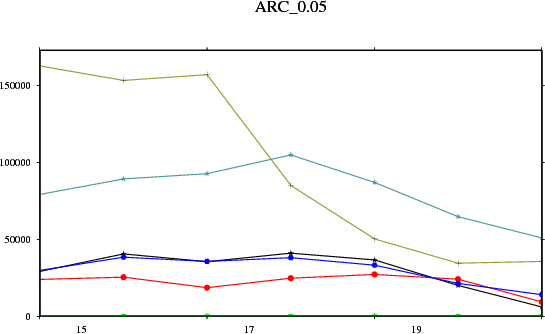
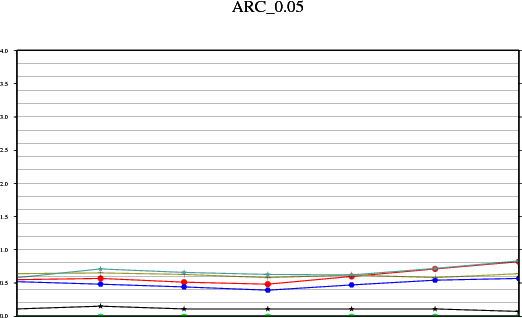
| Anomalies between SST from Coriolis bouys - SST analysis. Light grey area is ice. | |
|---|---|
| Startdate: 2011-02-01 Enddate: 2011-02-08 | |
 |
       |
| Startdate: 2011-02-02 Enddate: 2011-02-09 | |
 |
       |
| Startdate: 2011-02-03 Enddate: 2011-02-10 | |
 |
       |
| Startdate: 2011-02-04 Enddate: 2011-02-11 | |
 |
       |
| Startdate: 2011-02-05 Enddate: 2011-02-12 | |
 |
       |
| Startdate: 2011-02-06 Enddate: 2011-02-13 | |
 |
       |
| Startdate: 2011-02-07 Enddate: 2011-02-14 | |
 |
       |
| Startdate: 2011-02-08 Enddate: 2011-02-15 | |
 |
       |
| Startdate: 2011-02-09 Enddate: 2011-02-16 | |
 |
       |
| Startdate: 2011-02-10 Enddate: 2011-02-17 | |
 |
       |
| Startdate: 2011-02-11 Enddate: 2011-02-18 | |
 |
       |
| Startdate: 2011-02-12 Enddate: 2011-02-19 | |
 |
       |
| Startdate: 2011-02-13 Enddate: 2011-02-20 | |
 |
       |
| Startdate: 2011-02-14 Enddate: 2011-02-21 | |
 |
       |
| Startdate: 2011-02-15 Enddate: 2011-02-22 | |
 |
       |