Validation metrics for ice edge position and ice concentration
Prior to performing the validation, ARC-MFC PHY_ICE model results are integrated onto the 10km map projection on which the observations are avaliable.
Sea ice concentration
We present validation results computed from differences between the ARC-MFC PHY_ICE forecasts and the observations from the passive microwave product in the Copernicus Marine Service (product SEAICE_GLO_SEAICE_L4_NRT_OBSERVATIONS_011_001).
Validation results may become substantially inflated due to the unchallenging effort to forecast the sea ice concentration in most of the area covered by open waters, and also deep inside ice infested waters. This is done by restricting the analysis to a band that first covers regions where the observations have an ice cover with concentrations smaller than 0.9. Then, a padding region is applied, which extends 200km into the open ocean on one side, and into high sea ice concentrations on the other side.
Time series are plotted for the concentration bias (defined as model-observation), the mean absolute difference (MAD, sometimes referred to as MAE, mean absolute error), and the RMS difference. Besides the regional limitation described above, all these quantities are computed using standard definitions.
Ice edge position
The ice edge is defined by the set of grid cells that have ice concentrations exceeding a prescribed value, and at least one neighbour cell with concentration below the same limit. Here, we define the ice edge by setting this limiting sea ice concentration value to 0.1.
Ice edge length
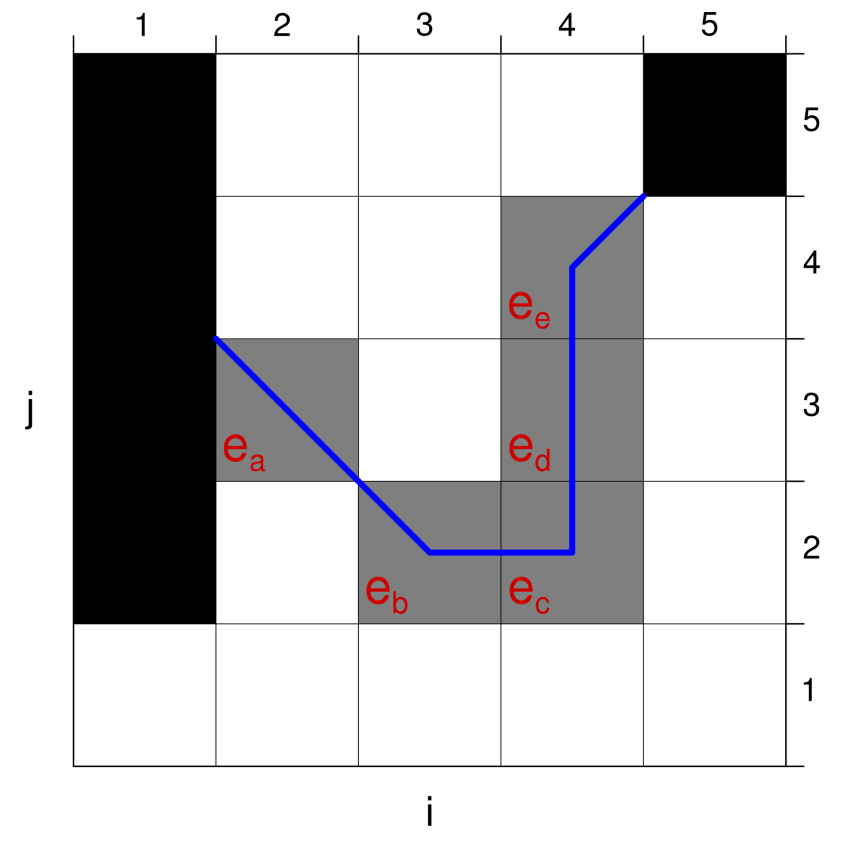
The length of the ice edge is defined as the piecewise horizontal, vertical and diagonal line segments through the centers of the ice edge grid cells. See the schematic figure for an explanation. The ice edge is displayed by the labelled gray cells. Black cells correspond to land. In grid units, the length here becomes 3+2*sqrt(2).
Distance between two edge lines
Let do be the shortest distance from a grid cell cell that belongs to the observed ice edge, to the model ice edge line. And vice versa for dm.
The average distance between the two edge lines can then be defined as
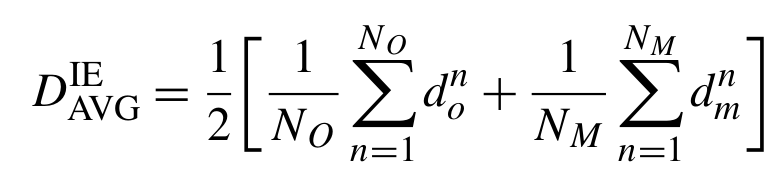
where NO, NM are the number of edge grid cells in the observed and modelled ice edges, respectively. We then define a bias by indroducing signs, by applying negative values for d when the observed ice edge has larger sea ice concentrations than the corresponding model values. Then, the bias is positive if the modelled ice edge is inside the ice infested region in the observations.
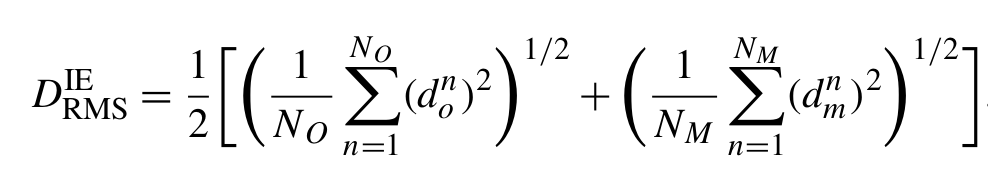
The root-mean-square of the ice edges' distance becomes
Area-based ice edge distance metrics
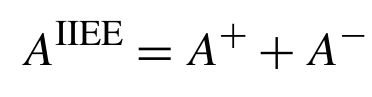
Here we base the metrics on the Integrated Ice-Edge Error, as introduced by Goessling et al. (Geophys. Res. Lett., 2016). This metric is derived from differences in sea ice extent, which is the ice covered region that has the ice edge as its perimeter.
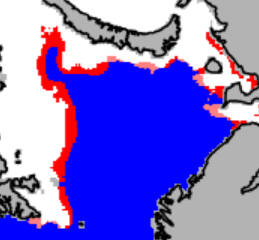
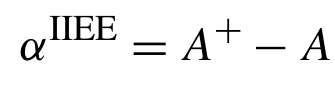
Let A+ be the area inside the ice extent in the model product, but outside extent in the observations. This is displayed by light red in the map detail. Then define A- correspondingly for observed sea ice that extends into the open ocean from the perspective of the model results (area in full red on map). The IIEE metric is then defined as
while the IIEE bias is defined as
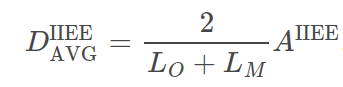
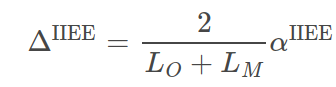
In order to create a edge distance metric, we simply divide areas by the average ice edge lengths (as defined here). Let LO, LM be the observed and modelled ice edge lengths, respectively. The average edge distance then becomes
while the IIEE edge distance bias becomes
We now have sets of two metrics for evaluation of results for the distance between two ice edges (actually applicable to two lines in general). It is then of interest to compare results from the two approaches. This is done by examining their ratio, e.g. for the average displacement we introduce the ratio.
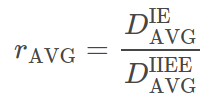
This is the quantity displayed under "Relative distance metrics [IE/IIEE]" on the web pages with the weekly results.
Fractions skill score (FSS), reference
The definition of the fractions skill score for the representation of a line is too complicated for this presentation. The interested reader is referred to Section 2.3 in A. Melsom et al. (Ocean Sci., 2019) Additional details regarding the ice edge validation metrics are also given in this paper.