CMEMS Arctic MFC: Validation of GLO-NEMO sea level anomaly and geostrophic velocity

Multi-model approach

Here, we present validation results from CMEMS global ocean circulation model, in order to provide product quality information that is supplementary to the results from CMEMS-ARC. Processing and computation of metrics are performed identically to the implementation for the ARC product, from which validation results are presented from this page.

Validation based on satellite data from Jason-2, Jason-3

Validation of the CMEMS Arctic MFC results for sea level anomaly and geostrophic velocity is performed using altimeter data from the the Jason-2 satellite and (from 2016-09-08) the Jason-3 satellite. These data have been corrected for a number of processes, including removal of the tidal signal and correction for the inverse barometer effect. See this document for an explanation of the various corrections that are applied. Note that altimeter data from Jason-2/-3 are assimilated in the EnKF used in the TOPAZ model. However, we use an updated product for this validation, which may have improvements due to an updated computation of the inverse barometer, and more precise knowledge of the satellite orbit.

Each Jason cycle is diveded into 254 tracks, half of which are ascending and half are descending (more below). The instrument's sampling frequency is approximately 0.927 Hz, corresponding to a horizontal separation of about 18.5 km along the track.

Jason-2/-3 data are available from the CMEMS product SEALEVEL_GLO_PHY_L3_NRT_OBSERVATIONS_008_044.

Results by bulletin date
January 2024
01-04
01-11
01-18
01-25

February 2024
02-01
02-08
02-15
02-22
02-29

March 2024
03-07
03-14
03-21
03-28

January 2023
01-05
01-12
01-19
01-26

February 2023
02-02
02-09
02-16
02-23

March 2023
03-02
03-09
03-16
03-23
03-30

April 2023
04-06
04-13
04-20
04-27

May 2023
05-04
05-11
05-18
05-25

June 2023
06-01
06-08
06-15
06-22
06-29

July 2023
07-06
07-13
07-20
07-27

August 2023
08-03
08-10
08-17
08-24
08-31

September 2023
09-07
09-14
09-21
09-28

October 2023
10-05
10-12
10-19
10-26

November 2023
11-02
11-09
11-16
11-23
11-30

December 2023
12-07
12-14
12-21
12-28

January 2022
01-06
01-13
01-20
01-27

February 2022
02-03
02-10
02-17
02-24

March 2022
03-03
03-10
03-17
03-24
03-31

April 2022
04-07

May 2022
05-12
05-19
05-26

June 2022
06-02
06-09
06-16
06-23
06-30

July 2022
07-07
07-14
07-21
07-28

August 2022
08-04
08-11
08-18
08-25

September 2022
09-01
09-08
09-15
09-22
09-29

October 2022
10-06
10-13
10-20
10-27

November 2022
11-03
11-10
11-17
11-24

December 2022
12-01
12-08
12-15
12-22
12-29

January 2021
01-07
01-14
01-21
01-28

February 2021
02-04
02-11
02-18
02-25

March 2021
03-04
03-11
03-18
03-25

April 2021
04-01
04-08
04-15
04-22
04-29

May 2021
05-06
05-13
05-20
05-27

June 2021
06-03
06-10
06-17
06-24

July 2021
07-01
07-08
07-15
07-22
07-29

August 2021
08-05
08-12
08-19
08-26

September 2021
09-02
09-09
09-16
09-23
09-30

October 2021
10-07
10-14
10-21
10-28

November 2021
11-04
11-11
11-18
11-25

December 2021
12-02
12-09
12-16
12-23
12-30

January 2020
01-02
01-09
01-16
01-23
01-30

February 2020
02-06
02-13
02-20
02-27

March 2020
03-05
03-12
03-19
03-26

April 2020
04-02
04-09
04-16
04-23
04-30

May 2020
05-07
05-14
05-21
05-28

June 2020
06-04
06-11
06-18
06-25

July 2020
07-02
07-09
07-16
07-23
07-30

August 2020
08-06
08-13
08-20
08-27

September 2020
09-03
09-10
09-17
09-24

October 2020
10-01
10-08
10-15
10-22
10-29

November 2020
11-05
11-12
11-19
11-26

December 2020
12-03
12-10
12-17
12-24
12-31

January 2019
01-03
01-10
01-17
01-24
01-31

February 2019
02-07
02-14
02-21
02-28

March 2019
03-07
03-14
03-21
03-28

April 2019
04-04
04-11
04-18
04-25

May 2019
05-02
05-09
05-16
05-23
05-30

June 2019
06-06
06-13
06-20
06-27

July 2019
07-04
07-11
07-18
07-25

August 2019
08-01
08-08
08-15
08-22
08-29

September 2019
09-05
09-12
09-19
09-26

October 2019
10-03
10-10
10-17
10-24
10-31

November 2019
11-07
11-14
11-21
11-28

December 2019
12-05
12-12
12-19
12-26

January 2018
01-04
01-11
01-18
01-25

February 2018
02-01
02-08
02-15
02-22

March 2018
03-01
03-08
03-15
03-22
03-29

April 2018
04-05
04-12
04-19
04-26

May 2018
05-03
05-10
05-17
05-24
05-31

June 2018
06-07
06-14
06-21
06-28

July 2018
07-05
07-12
07-19
07-26

August 2018
08-02
08-09
08-16
08-23
08-30

September 2018
09-06
09-13
09-20
09-27

October 2018
10-04
10-11
10-18
10-25

November 2018
11-01
11-08
11-15
11-22
11-29

December 2018
12-06
12-13
12-20
12-27

January 2017
01-05
01-12
01-19
01-26

February 2017
02-02
02-09
02-16
02-23

March 2017
03-02
03-09
03-16
03-23
03-30

April 2017
04-06
04-13
04-20
04-27

May 2017
05-04
05-11
05-18
05-25

June 2017
06-01
06-08
06-15
06-22
06-29

July 2017
07-06
07-13
07-20
07-27

August 2017
08-03
08-10
08-17
08-24
08-31

September 2017
09-07
09-14
09-21
09-28

October 2017
10-05
10-12
10-19
10-26

November 2017
11-02
11-09
11-16
11-23
11-30

December 2017
12-07
12-14
12-21
12-28

Validation based on satellite data from CryoSat-2

Validation of the CMEMS Arctic MFC results for sea level anomaly and geostrophic velocity is also performed using altimeter data from the the CryoSat-2 satellite. These data have been corrected similarly to those from the Jason missions (see details above).

The CryoSat repeat cycle is diveded into 5344 tracks, covered during 369 days of operations. This repeat cycle is made up of sub-cycles from approximately 30 days. The orbit period is 99.16 minutes. More information about the CryoSat mission is available from ESA.

CryoSat-2 data are available from the CMEMS product SEALEVEL_GLO_PHY_L3_NRT_OBSERVATIONS_008_044.

Results by bulletin date
January 2024
01-04
01-11
01-18
01-25

February 2024
02-01
02-08
02-15
02-22
02-29

March 2024
03-07
03-14
03-21
03-28

January 2023
01-05
01-12
01-19
01-26

February 2023
02-02
02-09
02-16
02-23

March 2023
03-02
03-09
03-16
03-23
03-30

April 2023
04-06
04-13
04-20
04-27

May 2023
05-04
05-11
05-18
05-25

June 2023
06-01
06-08
06-15
06-22
06-29

July 2023
07-06
07-13
07-20
07-27

August 2023
08-03
08-10
08-17
08-24
08-31

September 2023
09-07
09-14
09-21
09-28

October 2023
10-05
10-12
10-19
10-26

November 2023
11-02
11-09
11-16
11-23
11-30

December 2023
12-07
12-14
12-21
12-28

January 2022
01-06
01-13
01-20
01-27

February 2022
02-03
02-10
02-17
02-24

March 2022
03-03
03-10
03-17
03-24
03-31

April 2022
04-07
04-14
04-21
04-28

May 2022
05-05
05-12
05-19
05-26

June 2022
06-02
06-09
06-16
06-23
06-30

July 2022
07-07
07-14
07-21
07-28

August 2022
08-04
08-11
08-18
08-25

September 2022
09-01
09-08
09-15
09-22
09-29

October 2022
10-06
10-13
10-20
10-27

November 2022
11-03
11-10
11-17
11-24

December 2022
12-01
12-08
12-15
12-22
12-29

January 2021
01-07
01-14
01-21
01-28

February 2021
02-04
02-11
02-18
02-25

March 2021
03-04
03-11
03-18
03-25

April 2021
04-01
04-08
04-15
04-22
04-29

May 2021
05-06
05-13
05-20
05-27

June 2021
06-03
06-10
06-17
06-24

July 2021
07-01
07-08
07-15
07-22
07-29

August 2021
08-05
08-12
08-19
08-26

September 2021
09-02
09-09
09-16
09-23
09-30

October 2021
10-07
10-14
10-21
10-28

November 2021
11-04
11-11
11-18
11-25

December 2021
12-02
12-09
12-16
12-23
12-30

January 2020
01-02
01-09
01-16
01-23
01-30

February 2020
02-06
02-13
02-20
02-27

March 2020
03-05
03-12
03-19
03-26

April 2020
04-02
04-09
04-16
04-23
04-30

May 2020
05-07
05-14
05-21
05-28

June 2020
06-04
06-11
06-18
06-25

July 2020
07-02
07-09
07-16

October 2020
10-08
10-15
10-22
10-29

November 2020
11-05
11-12
11-19
11-26

December 2020
12-03
12-10
12-17
12-24
12-31

January 2019
01-03
01-10
01-17
01-24
01-31

February 2019
02-07
02-14
02-21
02-28

March 2019
03-07
03-14
03-21
03-28

April 2019
04-04
04-11
04-18
04-25

May 2019
05-02
05-09
05-16
05-23
05-30

June 2019
06-06
06-13
06-20
06-27

July 2019
07-04
07-11
07-18
07-25

August 2019
08-01
08-08
08-15
08-22
08-29

September 2019
09-05
09-12
09-19
09-26

October 2019
10-03
10-10
10-17
10-24
10-31

November 2019
11-07
11-14
11-21
11-28

December 2019
12-05
12-12
12-19
12-26

January 2018
01-04
01-11
01-18
01-25

February 2018
02-01
02-08
02-15
02-22

March 2018
03-01
03-08
03-15
03-22
03-29

April 2018
04-05
04-12
04-19
04-26

May 2018
05-03
05-10
05-17
05-24
05-31

June 2018
06-07
06-14
06-21
06-28

July 2018
07-05
07-12
07-19
07-26

August 2018
08-02
08-09
08-16
08-23
08-30

September 2018
09-06
09-13
09-20
09-27

October 2018
10-04
10-11
10-18
10-25

November 2018
11-01
11-08
11-15
11-22
11-29

December 2018
12-06
12-13
12-20
12-27

January 2017
01-05
01-12
01-19
01-26

February 2017
02-02
02-09
02-16
02-23

March 2017
03-02
03-09
03-16
03-23
03-30

April 2017
04-06
04-13
04-20
04-27

May 2017
05-04
05-11
05-18
05-25

June 2017
06-01
06-08
06-15
06-22
06-29

July 2017
07-06
07-13
07-20
07-27

August 2017
08-03
08-10
08-17
08-24
08-31

September 2017
09-07
09-14
09-21
09-28

October 2017
10-05
10-12
10-19
10-26

November 2017
11-02
11-09
11-16
11-23
11-30

December 2017
12-07
12-14
12-21
12-28

Validation based on satellite data from Sentinel-6a

Validation of the CMEMS Arctic MFC results for sea level anomaly and geostrophic velocity is additionally performed using altimeter data from the the Sentinel-6 satellite. These data have been corrected similarly to the other mission s (see details above).

Sentinel-6a was placed in the Jason-3 orbit, from which it has provided observations of sea level anomalies from March 2022 onwards. At the same time Sen tinel-6a have also substituted Jason-3 as the reference altimeter mission. The repeat cycle and track data are thus identical to the information provided fo r Jason-2/-3 above. The initial analysis of observations from Sentinel reveals that the data quality beats initial expectations. This analysis is described by ES A.

Results by bulletin date
January 2024
01-04
01-11
01-18
01-25

February 2024
02-01
02-08
02-15
02-22
02-29

March 2024
03-07
03-14
03-21
03-28

January 2023
01-05
01-12
01-19
01-26

February 2023
02-02
02-09
02-16
02-23

March 2023
03-02
03-09
03-16
03-23
03-30

April 2023
04-06
04-13
04-20
04-27

May 2023
05-04
05-11
05-18
05-25

June 2023
06-01
06-08
06-15
06-22
06-29

July 2023
07-06
07-13
07-20
07-27

August 2023
08-03
08-10
08-17
08-24
08-31

September 2023
09-07
09-14
09-21
09-28

October 2023
10-05
10-12
10-19
10-26

November 2023
11-02
11-09
11-16
11-23
11-30

December 2023
12-07
12-14
12-21
12-28

March 2022
03-24
03-31

April 2022
04-07
04-14
04-21
04-28

May 2022
05-05
05-12
05-19
05-26

June 2022
06-02
06-09
06-16
06-23
06-30

July 2022
07-07
07-14
07-21
07-28

August 2022
08-04
08-11
08-18
08-25

September 2022
09-01
09-08
09-15
09-22
09-29

October 2022
10-06
10-13
10-20
10-27

November 2022
11-03
11-10
11-17
11-24

December 2022
12-01
12-08
12-15
12-22
12-29

Regions

Validation regions Jason

Jason

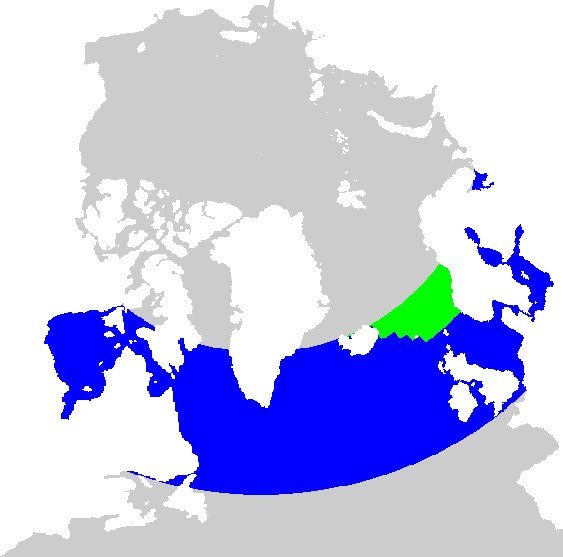
The ocean circulation model used in CMEMS's Arctic MFC covers the Arctic Ocean, the North Atlantic Ocean and adjacent ocean regions. The northern part is depicted in the figure to the left. Validation of sea level anomalies from model results are performed for two domains:

  • an extended domain indicated by the blue and green regions in the figure
  • the Nordic Seas, shown as the green region

The validation is performed using processed data from the altimeter onboard the Jason-2 and Jason-3 satellites. The region covered by the satellite is limited by the 66° 8' parallell, as indicated in the figure below. This limit in the poleward extent of data significantly reduces the extent of the key domain for CMEMS's Arctic Monitoring and Forecasting Centre. However, using Jason-2 data almost eliminates possible problems due to the presence of sea ice at higher latitudes.

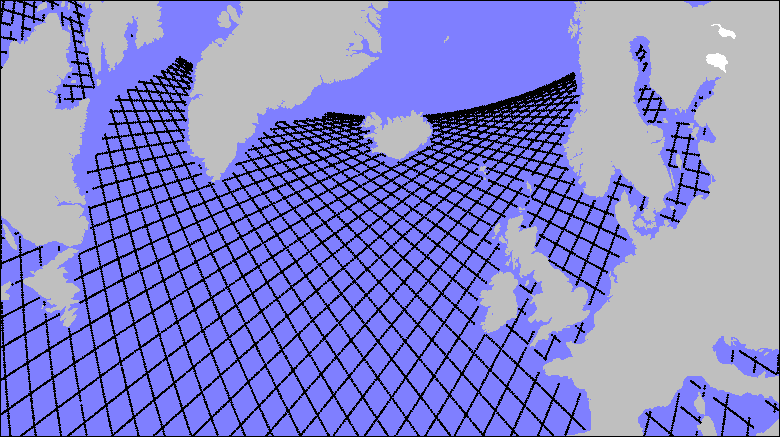
Like its predecessors TOPEX/Poseidon and Jason-1, Jason-2 and Jason-3 have an orbital period of 6754 s (1:52:34). The full surface trace is constituted by 254 tracks, with one ascending track and one descending track in each orbit. Tracks in the region relevant for the Arctic Monitoring and Forecasting Centre are shown by the black curves below. The repeat period then becomes approximately 10 days.

Using tide gauge data from around the world as reference, validation of Jason-2 altimetry data has revealed a standard deviation of the sea level anomaly of approxiately 4 cm, see this report for details.

Validation regions CryoSat

CryoSat

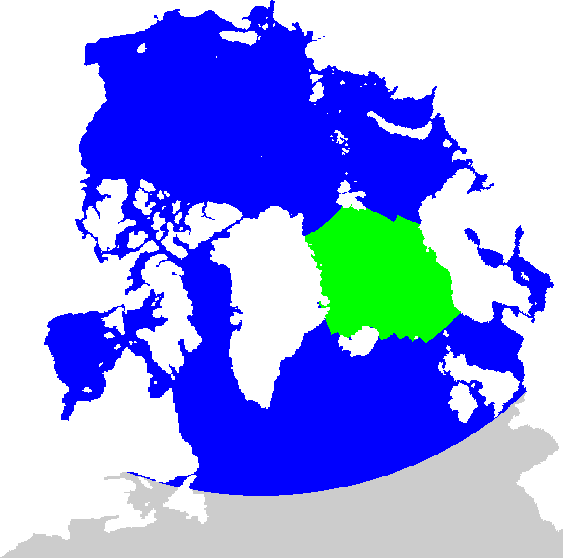
Similarly to the validation that uses data from the Jason missions, we consider two domains:

  • an extended domain indicated by the blue and green regions in the figure
  • the Nordic Seas, shown as the green region

Note that the CryoSat mission extends much further north than the extent of the Jason missions. Data from CryoSat are available as far north as approximately 82°N.

Processing

Sea level anomaly

The RMS difference between model sea level and observations is calculated track-by-track. Before the root-mean-square differences and correlations are computed, the following processing is performed:

  • data are extracted for a calendar day
  • data that are either outside of the validation domain or outside of the wet part of the TOPAZ domain, are discarded (tracks with no data inside the domain are disregarded)
  • model results (daily mean values) corresponding to the remaining data are extracted from the TOPAZ results
  • along-track model anomalies are derived by subtraction of the local model sea level climatology
T/P, Jason ground tracks

The full set of Jason ground tracks north of 50°N.

Jason-2 suffered from an onboard memory error which was detected on 2013-03-25. As a consequence, there were periods with data outages in late March and early April in 2013.

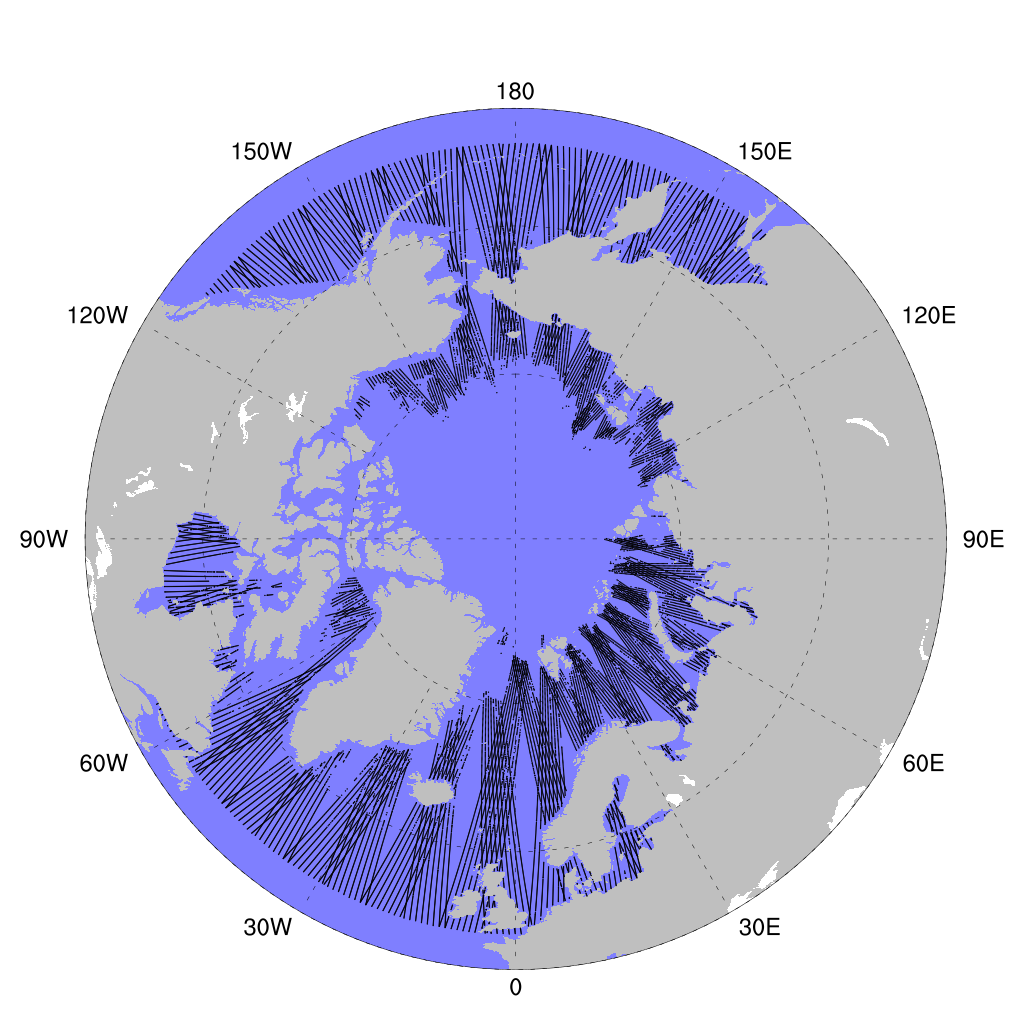
CryoSat ground tracks sample

CryoSat ground tracks north of 50°N. The figure shows an example of the coverage during the time period covered during one of the weekly validation bulletins (17 days).

Geostrophic velocity component

Here, we take advantage of the relationship between the sea surface slope and geostrophic velocity. Since sea level data are only available along the satellites' ground tracks, we are restricted to assessing the component of velocity normal to these tracks.

The relationship between sea surface slope along the track, hs and speed of current component normal to the track, vgstr, is
   vgstr = g|hs/f|
where g is the gravitational acceleration and f is the local Coriolis parameter.

In order to compare the geostrophic velocity component derived from observations, we adopt the same approach for the model results (and not model velocity), i.e., we compute this quantity based on model results for sea level. Note that to comply with the algorithm for computation of anomalies for sea level as described above, we here add the model climatology to the observed sea level anomalies (we choose to compare speed, not speed anomalies).

Finally, in order to account for directional differences in the derived results for speed of the geostrophic velocity component, the model results are set to a negative value in cases were the slope sign is opposite in model and observations.

NEMO

The model results are produced with the NEMO assimilative ocean model system (CMEMS product GLOBAL_ANALYSIS_FORECAST_PHY_001_024 from 2016-10-27, and the now deprecated GLOBAL_ANALYSIS_FORECAST_PHYS_001_002 for validations before 2016-10-27). Presently, NEMO assimilates data for sea surface temperature, sea level anomalies, temperature and salinity profiles, and sea ice concentration.
The ocean circulation model product is developed and maintained by Mercator Ocean.

NEMO results are freely available for registered CMEMS users from marine.copernicus.eu.

 
See Met Privacy