Validation of ice thickness - Full domain
Bulletin date: 2023-03-16
Model: ARC MFC - TOPAZ
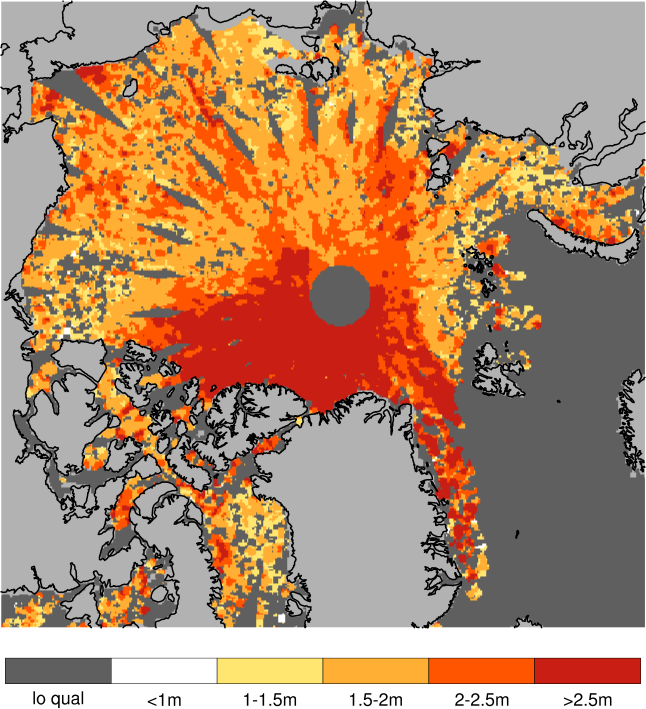
Data source: UCL CryoSAT-2 sea ice thickness
Validation statistics summary
| Bias (m) | RMS (m) | total grids | low SIT | OK SIT | high SIT | |
|---|---|---|---|---|---|---|
| Best estimate | -0.56 | 0.81 | 49720 | 7826 | 41808 | 86 |
| Day 1 forecast | -0.56 | 0.81 | 49720 | 7934 | 41696 | 90 |
| Day 4 forecast | -0.57 | 0.82 | 49720 | 8070 | 41560 | 90 |
| Day 7 forecast | -0.56 | 0.81 | 49720 | 7840 | 41784 | 96 |
| Day 10 forecast | -0.57 | 0.83 | 49720 | 8483 | 41146 | 91 |
Numbers in the three rightmost columns are grid counts. Regions with high/low sea ice thickness correspond to areas with model offsets from the gridded observations outside of one standard deviation. (Standard deviations are provided in the observational product.)
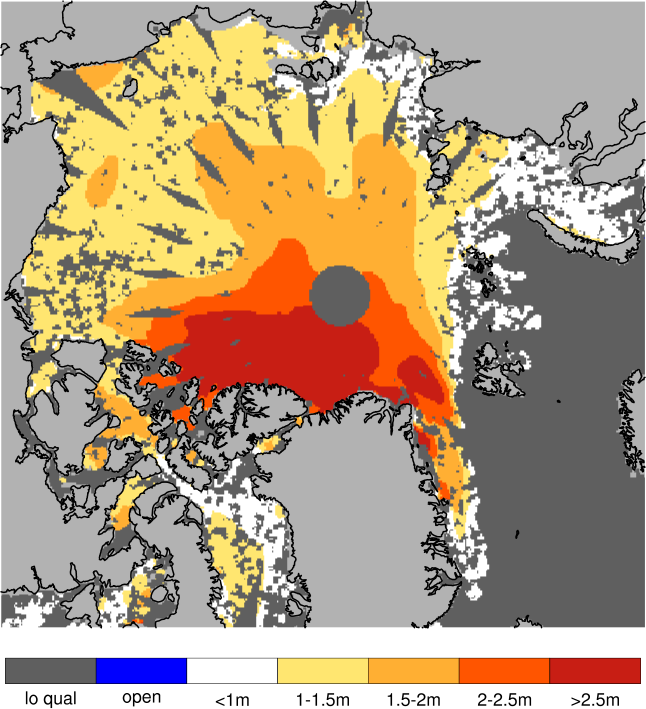
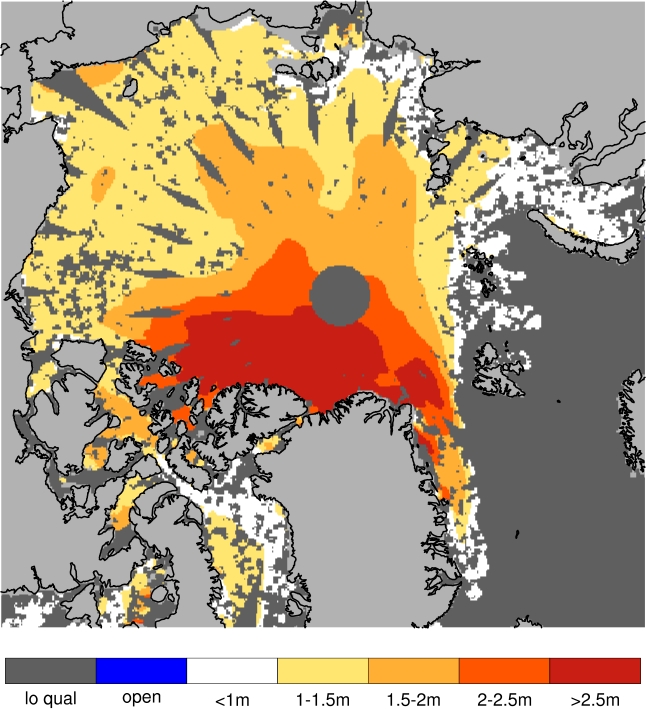
Definition of categories:
| Category | Sea ice thickness |
|---|---|
| c1 | <1m |
| c2 | 1 - 1.5m |
| c3 | 1.5 - 2m |
| c4 | 2 - 2.5m |
| c5 | 2.5 - 3m |
| c6 | >3m |
Best estimate vs. observations
Contingency table
| observations | |||||||||
|---|---|---|---|---|---|---|---|---|---|
| open | c1 | c2 | c3 | c4 | c5 | c6 | |||
| m o d e l |
open | 0 | 0 | 0 | 0 | 0 | 0 | 0 | |
| c1 | 0 | 0.002 | 0.047 | 0.087 | 0.028 | 0.009 | 0.003 | ||
| c2 | 0 | 0.001 | 0.049 | 0.258 | 0.081 | 0.011 | 0.003 | ||
| c3 | 0 | 0 | 0.003 | 0.098 | 0.108 | 0.015 | 0.003 | ||
| c4 | 0 | 0 | 0 | 0.004 | 0.027 | 0.043 | 0.007 | ||
| c5 | 0 | 0 | 0 | 0 | 0.006 | 0.042 | 0.043 | ||
| c6 | 0 | 0 | 0 | 0 | 0.001 | 0.004 | 0.014 | ||
See category definitions for details.
Statistical distribution
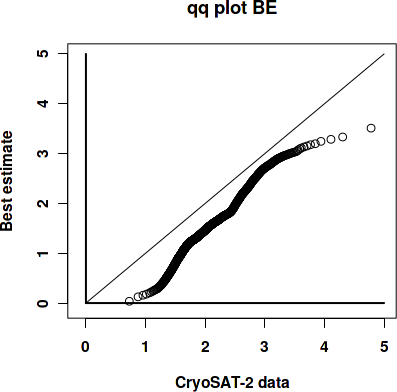
|
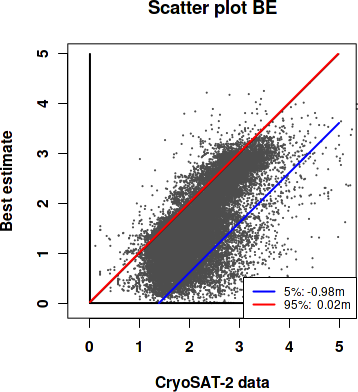
|
Observed sea ice thickness from CryoSAT
Sea ice thickness, best estimate product
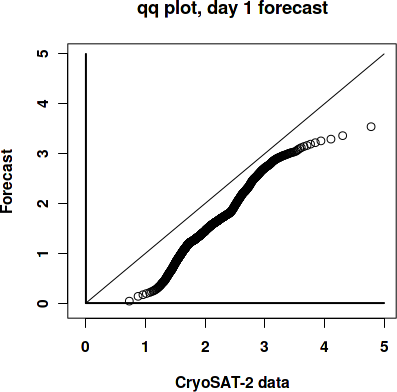
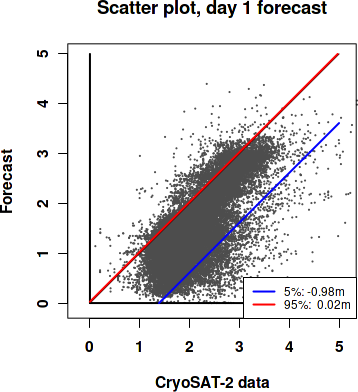
Day 1 forecast vs. observations
Contingency table
| observations | |||||||||
|---|---|---|---|---|---|---|---|---|---|
| open | c1 | c2 | c3 | c4 | c5 | c6 | |||
| m o d e l |
open | 0 | 0 | 0 | 0 | 0 | 0 | 0 | |
| c1 | 0 | 0.002 | 0.047 | 0.087 | 0.028 | 0.008 | 0.003 | ||
| c2 | 0 | 0.001 | 0.049 | 0.263 | 0.084 | 0.011 | 0.003 | ||
| c3 | 0 | 0 | 0.003 | 0.092 | 0.106 | 0.015 | 0.003 | ||
| c4 | 0 | 0 | 0 | 0.005 | 0.025 | 0.042 | 0.007 | ||
| c5 | 0 | 0 | 0 | 0 | 0.007 | 0.041 | 0.042 | ||
| c6 | 0 | 0 | 0 | 0 | 0.001 | 0.004 | 0.015 | ||
See category definitions for details.
Statistical distribution
|
|
Sea ice thickness, day 1 forecast
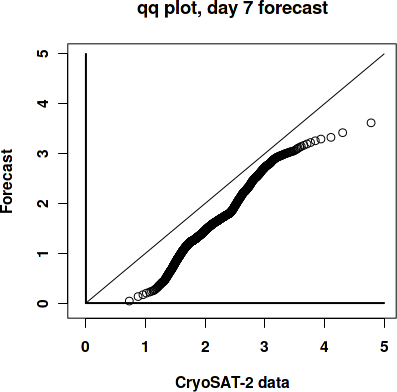
Day 7 forecast vs. observations
Contingency table
| observations | |||||||||
|---|---|---|---|---|---|---|---|---|---|
| open | c1 | c2 | c3 | c4 | c5 | c6 | |||
| m o d e l |
open | 0 | 0 | 0 | 0 | 0 | 0 | 0 | |
| c1 | 0 | 0.002 | 0.046 | 0.085 | 0.027 | 0.008 | 0.003 | ||
| c2 | 0 | 0.001 | 0.05 | 0.263 | 0.085 | 0.012 | 0.003 | ||
| c3 | 0 | 0 | 0.004 | 0.094 | 0.107 | 0.015 | 0.004 | ||
| c4 | 0 | 0 | 0 | 0.004 | 0.026 | 0.042 | 0.007 | ||
| c5 | 0 | 0 | 0 | 0.001 | 0.006 | 0.04 | 0.04 | ||
| c6 | 0 | 0 | 0 | 0 | 0.001 | 0.005 | 0.018 | ||
See category definitions for details.
Statistical distribution
|

|
Sea ice thickness, day 7 forecast

Generated by /metno/routine/sms/V2/SIthickness/c2iceWebPage.sh ma. 18. sep. 11:24:25 +0000 2023 on arcval