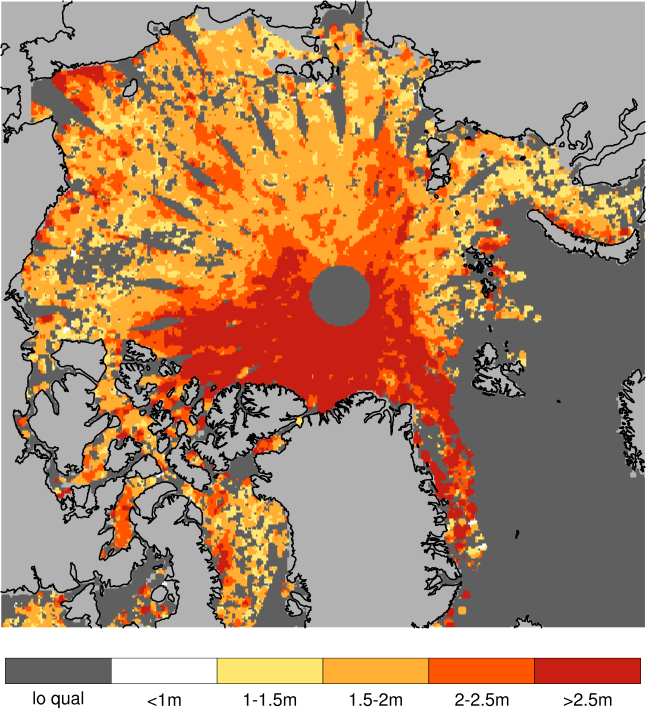
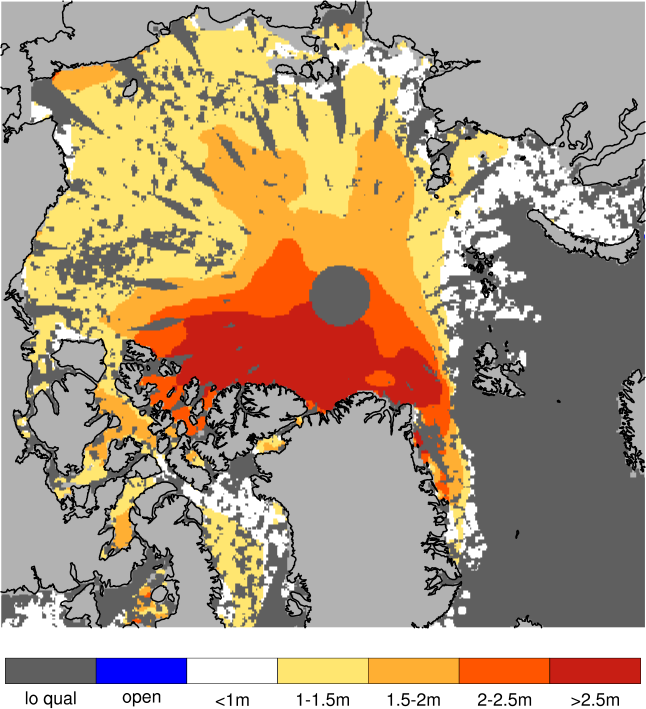
Validation of ice thickness - Full domain
Bulletin date: 2023-03-09
Model: ARC MFC - TOPAZ
Data source: UCL CryoSAT-2 sea ice thickness
Validation statistics summary
| Bias (m) | RMS (m) | total grids | low SIT | OK SIT | high SIT | |
|---|---|---|---|---|---|---|
| Best estimate | -0.57 | 0.92 | 48948 | 7796 | 41052 | 100 |
| Day 1 forecast | -0.57 | 0.92 | 48948 | 7865 | 40980 | 103 |
| Day 4 forecast | -0.58 | 0.92 | 48948 | 7964 | 40879 | 105 |
| Day 7 forecast | -0.56 | 0.92 | 48948 | 7745 | 41082 | 121 |
| Day 10 forecast | -0.57 | 0.93 | 48948 | 8121 | 40699 | 128 |
Numbers in the three rightmost columns are grid counts. Regions with high/low sea ice thickness correspond to areas with model offsets from the gridded observations outside of one standard deviation. (Standard deviations are provided in the observational product.)
Definition of categories:
| Category | Sea ice thickness |
|---|---|
| c1 | <1m |
| c2 | 1 - 1.5m |
| c3 | 1.5 - 2m |
| c4 | 2 - 2.5m |
| c5 | 2.5 - 3m |
| c6 | >3m |
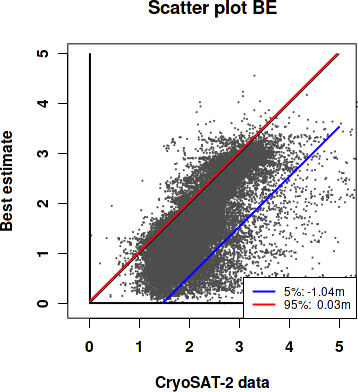
Best estimate vs. observations
Contingency table
| observations | |||||||||
|---|---|---|---|---|---|---|---|---|---|
| open | c1 | c2 | c3 | c4 | c5 | c6 | |||
| m o d e l |
open | 0 | 0 | 0 | 0 | 0 | 0 | 0 | |
| c1 | 0 | 0.003 | 0.057 | 0.085 | 0.027 | 0.009 | 0.006 | ||
| c2 | 0 | 0.001 | 0.066 | 0.267 | 0.063 | 0.01 | 0.004 | ||
| c3 | 0 | 0 | 0.005 | 0.089 | 0.087 | 0.015 | 0.005 | ||
| c4 | 0 | 0 | 0 | 0.006 | 0.026 | 0.042 | 0.008 | ||
| c5 | 0 | 0 | 0 | 0.001 | 0.007 | 0.044 | 0.044 | ||
| c6 | 0 | 0 | 0 | 0 | 0.001 | 0.003 | 0.017 | ||
See category definitions for details.
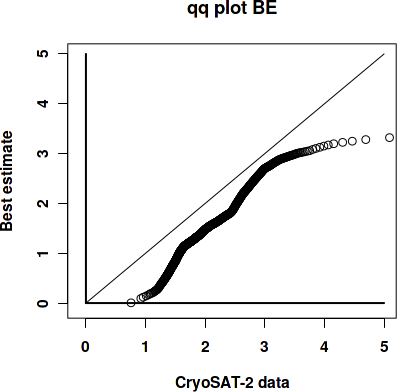
Statistical distribution
|
|
Observed sea ice thickness from CryoSAT
Sea ice thickness, best estimate product
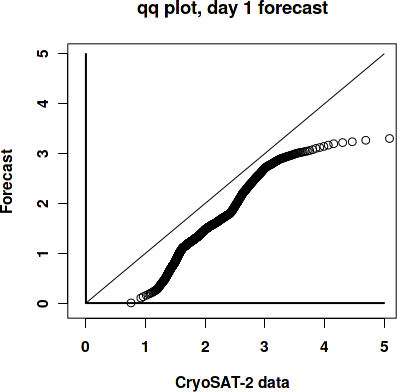
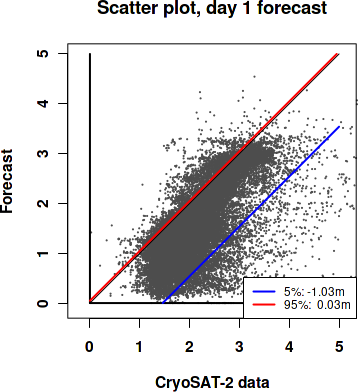
Day 1 forecast vs. observations
Contingency table
| observations | |||||||||
|---|---|---|---|---|---|---|---|---|---|
| open | c1 | c2 | c3 | c4 | c5 | c6 | |||
| m o d e l |
open | 0 | 0 | 0 | 0 | 0 | 0 | 0 | |
| c1 | 0 | 0.002 | 0.057 | 0.087 | 0.026 | 0.009 | 0.006 | ||
| c2 | 0 | 0.001 | 0.066 | 0.267 | 0.064 | 0.011 | 0.004 | ||
| c3 | 0 | 0 | 0.005 | 0.088 | 0.086 | 0.015 | 0.006 | ||
| c4 | 0 | 0 | 0 | 0.006 | 0.026 | 0.042 | 0.008 | ||
| c5 | 0 | 0 | 0 | 0.001 | 0.008 | 0.044 | 0.043 | ||
| c6 | 0 | 0 | 0 | 0 | 0.001 | 0.004 | 0.017 | ||
See category definitions for details.
Statistical distribution
|
|
Sea ice thickness, day 1 forecast

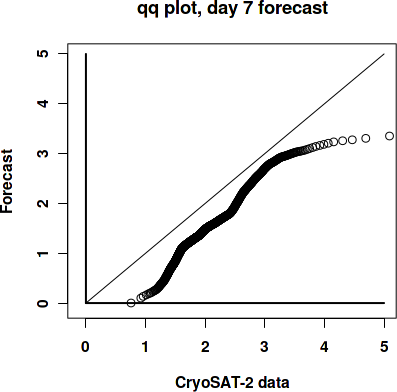
Day 7 forecast vs. observations
Contingency table
| observations | |||||||||
|---|---|---|---|---|---|---|---|---|---|
| open | c1 | c2 | c3 | c4 | c5 | c6 | |||
| m o d e l |
open | 0 | 0 | 0 | 0 | 0 | 0 | 0 | |
| c1 | 0 | 0.002 | 0.055 | 0.087 | 0.027 | 0.009 | 0.006 | ||
| c2 | 0 | 0.001 | 0.067 | 0.264 | 0.062 | 0.01 | 0.004 | ||
| c3 | 0 | 0 | 0.005 | 0.091 | 0.087 | 0.015 | 0.005 | ||
| c4 | 0 | 0 | 0 | 0.006 | 0.025 | 0.042 | 0.007 | ||
| c5 | 0 | 0 | 0 | 0.001 | 0.008 | 0.043 | 0.04 | ||
| c6 | 0 | 0 | 0 | 0 | 0.001 | 0.004 | 0.021 | ||
See category definitions for details.
Statistical distribution
|

|
Sea ice thickness, day 7 forecast

Generated by /metno/routine/sms/V2/SIthickness/c2iceWebPage.sh ma. 18. sep. 11:21:09 +0000 2023 on arcval