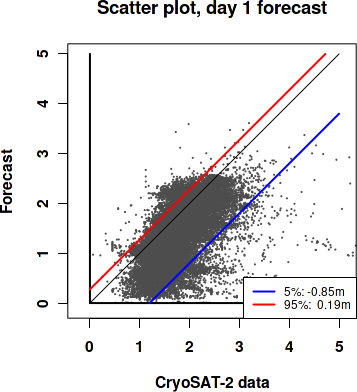
Validation of ice thickness - Full domain
Bulletin date: 2023-01-05
Model: ARC MFC - TOPAZ
Data source: UCL CryoSAT-2 sea ice thickness
Validation statistics summary
| Bias (m) | RMS (m) | total grids | low SIT | OK SIT | high SIT | |
|---|---|---|---|---|---|---|
| Best estimate | -0.38 | 0.61 | 33886 | 5282 | 28460 | 144 |
| Day 1 forecast | -0.39 | 0.62 | 33886 | 5311 | 28421 | 154 |
| Day 4 forecast | -0.39 | 0.62 | 33886 | 5392 | 28336 | 158 |
| Day 7 forecast | -0.38 | 0.62 | 33886 | 5291 | 28432 | 163 |
| Day 10 forecast | -0.4 | 0.64 | 33886 | 5632 | 28077 | 177 |
Numbers in the three rightmost columns are grid counts. Regions with high/low sea ice thickness correspond to areas with model offsets from the gridded observations outside of one standard deviation. (Standard deviations are provided in the observational product.)
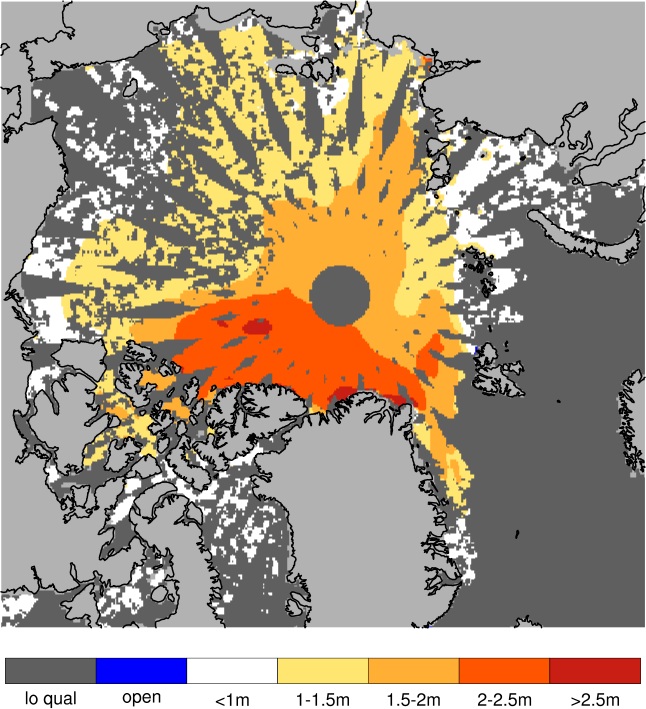
Definition of categories:
| Category | Sea ice thickness |
|---|---|
| c1 | <1m |
| c2 | 1 - 1.5m |
| c3 | 1.5 - 2m |
| c4 | 2 - 2.5m |
| c5 | 2.5 - 3m |
| c6 | >3m |
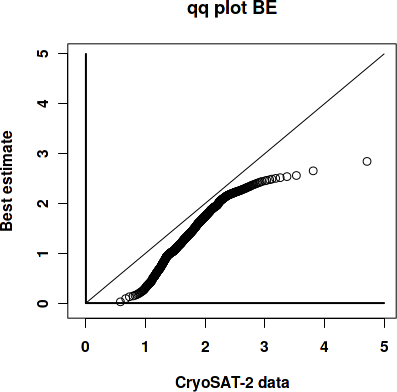
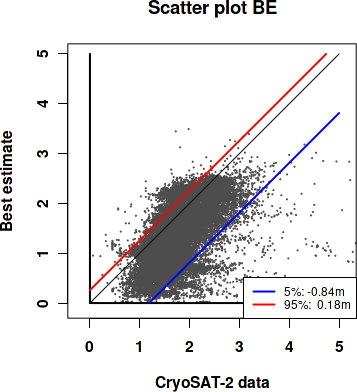
Best estimate vs. observations
Contingency table
| observations | |||||||||
|---|---|---|---|---|---|---|---|---|---|
| open | c1 | c2 | c3 | c4 | c5 | c6 | |||
| m o d e l |
open | 0 | 0 | 0 | 0 | 0 | 0 | 0 | |
| c1 | 0 | 0.019 | 0.153 | 0.076 | 0.018 | 0.004 | 0.002 | ||
| c2 | 0 | 0.005 | 0.152 | 0.121 | 0.023 | 0.003 | 0.002 | ||
| c3 | 0 | 0 | 0.015 | 0.112 | 0.104 | 0.015 | 0.003 | ||
| c4 | 0 | 0 | 0.003 | 0.043 | 0.084 | 0.029 | 0.005 | ||
| c5 | 0 | 0 | 0 | 0 | 0.003 | 0.003 | 0.003 | ||
| c6 | 0 | 0 | 0 | 0 | 0 | 0 | 0 | ||
See category definitions for details.
Statistical distribution
|
|
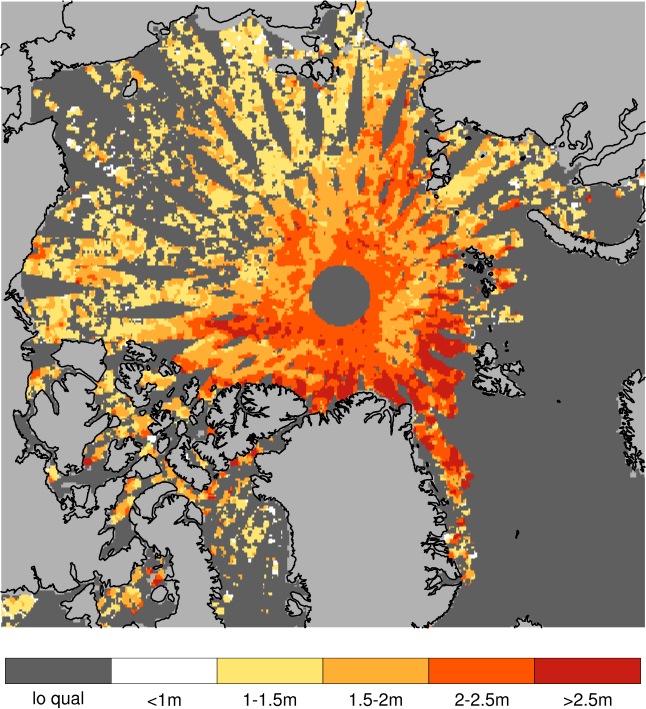
Observed sea ice thickness from CryoSAT
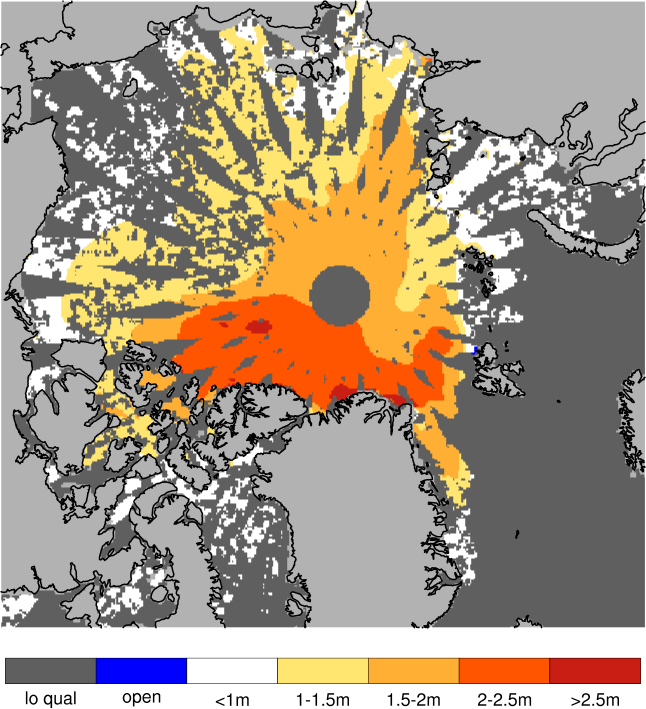
Sea ice thickness, best estimate product
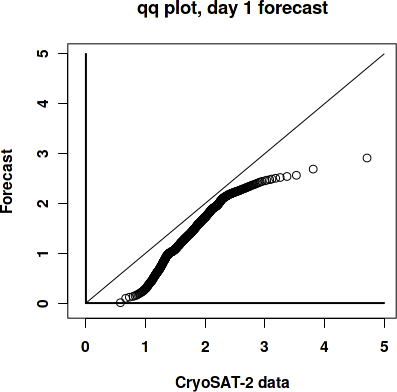
Day 1 forecast vs. observations
Contingency table
| observations | |||||||||
|---|---|---|---|---|---|---|---|---|---|
| open | c1 | c2 | c3 | c4 | c5 | c6 | |||
| m o d e l |
open | 0 | 0 | 0 | 0 | 0 | 0 | 0 | |
| c1 | 0 | 0.018 | 0.145 | 0.073 | 0.017 | 0.004 | 0.002 | ||
| c2 | 0 | 0.006 | 0.159 | 0.128 | 0.026 | 0.003 | 0.002 | ||
| c3 | 0 | 0 | 0.015 | 0.107 | 0.104 | 0.017 | 0.004 | ||
| c4 | 0 | 0 | 0.003 | 0.044 | 0.082 | 0.027 | 0.004 | ||
| c5 | 0 | 0 | 0 | 0 | 0.003 | 0.003 | 0.002 | ||
| c6 | 0 | 0 | 0 | 0 | 0 | 0 | 0 | ||
See category definitions for details.
Statistical distribution
|
|
Sea ice thickness, day 1 forecast

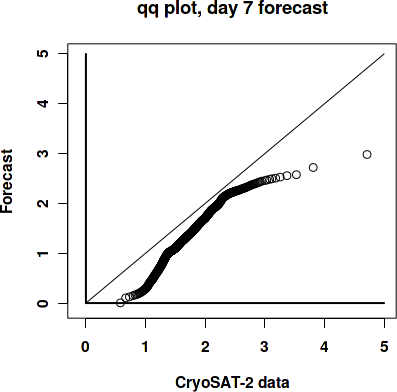
Day 7 forecast vs. observations
Contingency table
| observations | |||||||||
|---|---|---|---|---|---|---|---|---|---|
| open | c1 | c2 | c3 | c4 | c5 | c6 | |||
| m o d e l |
open | 0 | 0 | 0 | 0 | 0 | 0 | 0 | |
| c1 | 0 | 0.017 | 0.132 | 0.069 | 0.018 | 0.004 | 0.002 | ||
| c2 | 0 | 0.006 | 0.17 | 0.131 | 0.028 | 0.006 | 0.002 | ||
| c3 | 0 | 0 | 0.017 | 0.106 | 0.103 | 0.016 | 0.004 | ||
| c4 | 0 | 0 | 0.003 | 0.045 | 0.081 | 0.025 | 0.004 | ||
| c5 | 0 | 0 | 0 | 0 | 0.003 | 0.003 | 0.002 | ||
| c6 | 0 | 0 | 0 | 0 | 0 | 0 | 0.001 | ||
See category definitions for details.
Statistical distribution
|

|
Sea ice thickness, day 7 forecast
Generated by /metno/routine/sms/V2/SIthickness/c2iceWebPage.sh ma. 18. sep. 10:54:22 +0000 2023 on arcval