Validation of ice thickness - Full domain
Bulletin date: 2022-12-22
Model: ARC MFC - TOPAZ
Data source: UCL CryoSAT-2 sea ice thickness
Validation statistics summary
| Bias (m) | RMS (m) | total grids | low SIT | OK SIT | high SIT | |
|---|---|---|---|---|---|---|
| Best estimate | -0.5 | 0.7 | 39839 | 7860 | 31925 | 54 |
| Day 1 forecast | -0.51 | 0.71 | 39839 | 8226 | 31559 | 54 |
| Day 4 forecast | -0.52 | 0.72 | 39839 | 8425 | 31363 | 51 |
| Day 7 forecast | -0.51 | 0.7 | 39839 | 7989 | 31791 | 59 |
| Day 10 forecast | -0.54 | 0.73 | 39839 | 9083 | 30717 | 39 |
Numbers in the three rightmost columns are grid counts. Regions with high/low sea ice thickness correspond to areas with model offsets from the gridded observations outside of one standard deviation. (Standard deviations are provided in the observational product.)
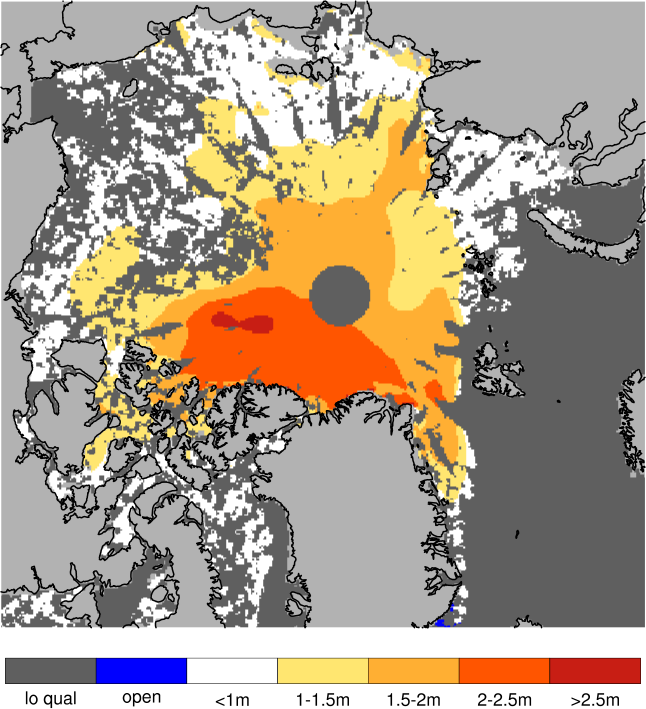
Definition of categories:
| Category | Sea ice thickness |
|---|---|
| c1 | <1m |
| c2 | 1 - 1.5m |
| c3 | 1.5 - 2m |
| c4 | 2 - 2.5m |
| c5 | 2.5 - 3m |
| c6 | >3m |
Best estimate vs. observations
Contingency table
| observations | |||||||||
|---|---|---|---|---|---|---|---|---|---|
| open | c1 | c2 | c3 | c4 | c5 | c6 | |||
| m o d e l |
open | 0 | 0 | 0 | 0 | 0 | 0 | 0 | |
| c1 | 0 | 0.018 | 0.218 | 0.118 | 0.021 | 0.005 | 0.005 | ||
| c2 | 0 | 0.002 | 0.079 | 0.136 | 0.033 | 0.005 | 0.001 | ||
| c3 | 0 | 0 | 0.013 | 0.065 | 0.112 | 0.021 | 0.005 | ||
| c4 | 0 | 0 | 0.001 | 0.031 | 0.08 | 0.018 | 0.005 | ||
| c5 | 0 | 0 | 0 | 0 | 0.002 | 0.005 | 0 | ||
| c6 | 0 | 0 | 0 | 0 | 0 | 0 | 0 | ||
See category definitions for details.
Statistical distribution
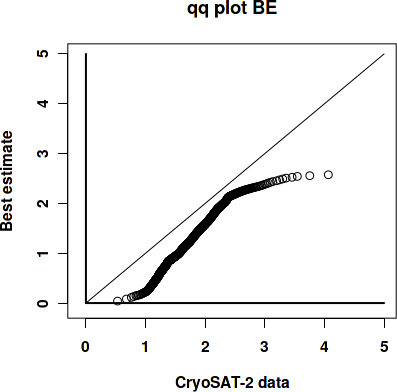
|
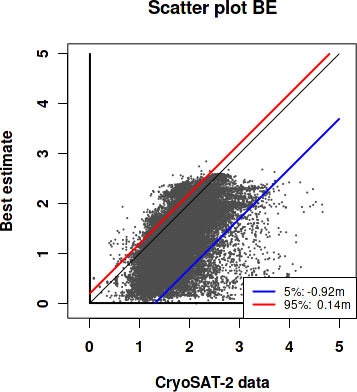
|
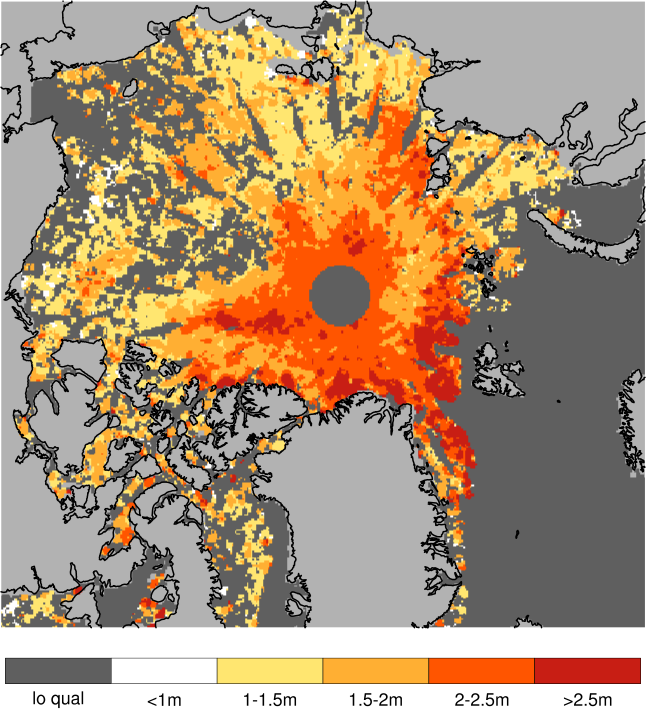
Observed sea ice thickness from CryoSAT
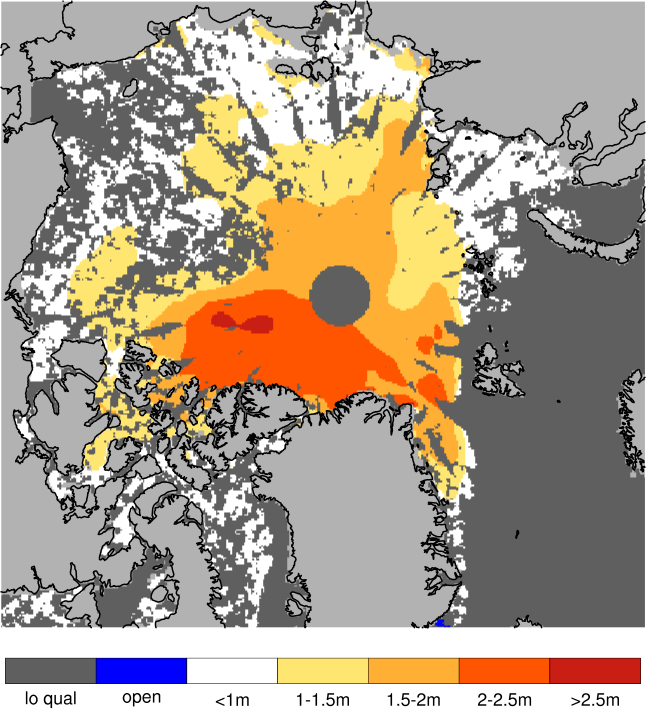
Sea ice thickness, best estimate product
Day 1 forecast vs. observations
Contingency table
| observations | |||||||||
|---|---|---|---|---|---|---|---|---|---|
| open | c1 | c2 | c3 | c4 | c5 | c6 | |||
| m o d e l |
open | 0 | 0 | 0 | 0 | 0 | 0 | 0 | |
| c1 | 0 | 0.018 | 0.221 | 0.123 | 0.021 | 0.005 | 0.004 | ||
| c2 | 0 | 0.002 | 0.077 | 0.133 | 0.037 | 0.006 | 0.002 | ||
| c3 | 0 | 0 | 0.013 | 0.062 | 0.108 | 0.023 | 0.006 | ||
| c4 | 0 | 0 | 0.001 | 0.032 | 0.08 | 0.016 | 0.004 | ||
| c5 | 0 | 0 | 0 | 0 | 0.002 | 0.005 | 0 | ||
| c6 | 0 | 0 | 0 | 0 | 0 | 0 | 0 | ||
See category definitions for details.
Statistical distribution
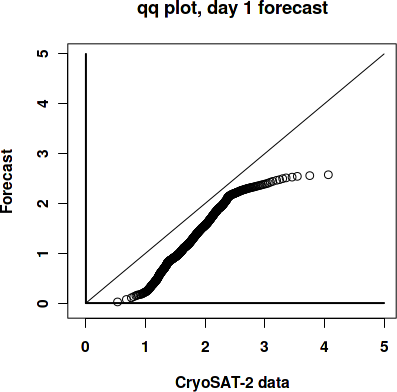
|
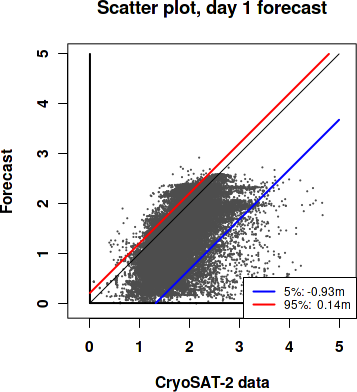
|
Sea ice thickness, day 1 forecast
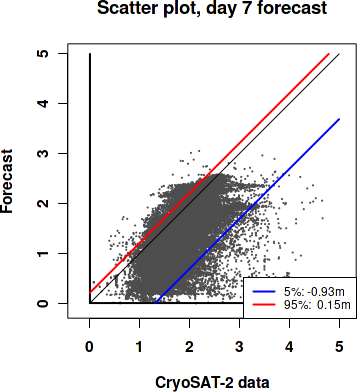
Day 7 forecast vs. observations
Contingency table
| observations | |||||||||
|---|---|---|---|---|---|---|---|---|---|
| open | c1 | c2 | c3 | c4 | c5 | c6 | |||
| m o d e l |
open | 0 | 0 | 0 | 0 | 0 | 0 | 0 | |
| c1 | 0 | 0.017 | 0.215 | 0.121 | 0.021 | 0.004 | 0.004 | ||
| c2 | 0 | 0.002 | 0.082 | 0.135 | 0.038 | 0.007 | 0.002 | ||
| c3 | 0 | 0 | 0.013 | 0.062 | 0.107 | 0.023 | 0.007 | ||
| c4 | 0 | 0 | 0.001 | 0.032 | 0.08 | 0.016 | 0.004 | ||
| c5 | 0 | 0 | 0 | 0 | 0.002 | 0.005 | 0 | ||
| c6 | 0 | 0 | 0 | 0 | 0 | 0 | 0 | ||
See category definitions for details.
Statistical distribution
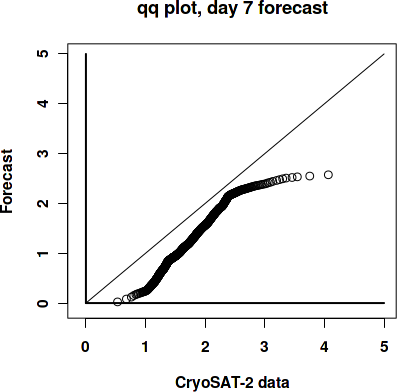
|
|
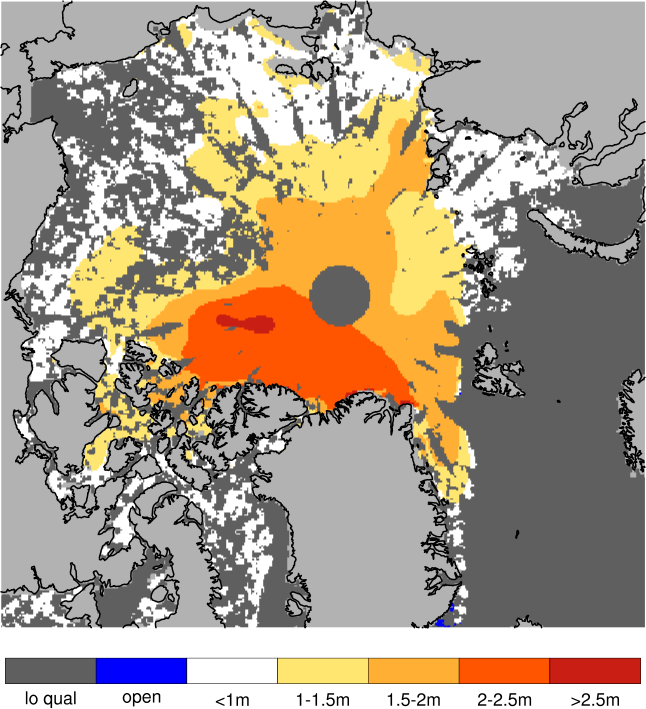
Sea ice thickness, day 7 forecast
Generated by /metno/routine/sms/V2/SIthickness/c2iceWebPage.sh ma. 18. sep. 10:40:58 +0000 2023 on arcval