Validation of ice thickness - Full domain
Bulletin date: 2022-03-31
Model: ARC MFC - TOPAZ
Data source: UCL CryoSAT-2 sea ice thickness
Validation statistics summary
| Bias (m) | RMS (m) | total grids | low SIT | OK SIT | high SIT | |
|---|---|---|---|---|---|---|
| Best estimate | -0.38 | 0.68 | 52428 | 8530 | 43766 | 132 |
| Day 1 forecast | -0.38 | 0.68 | 52428 | 8385 | 43895 | 148 |
| Day 4 forecast | -0.39 | 0.69 | 52428 | 8420 | 43850 | 158 |
| Day 7 forecast | -0.38 | 0.68 | 52428 | 8203 | 44067 | 158 |
| Day 10 forecast | -0.41 | 0.7 | 52428 | 8485 | 43694 | 249 |
Numbers in the three rightmost columns are grid counts. Regions with high/low sea ice thickness correspond to areas with model offsets from the gridded observations outside of one standard deviation. (Standard deviations are provided in the observational product.)
Definition of categories:
| Category | Sea ice thickness |
|---|---|
| c1 | <1m |
| c2 | 1 - 1.5m |
| c3 | 1.5 - 2m |
| c4 | 2 - 2.5m |
| c5 | 2.5 - 3m |
| c6 | >3m |
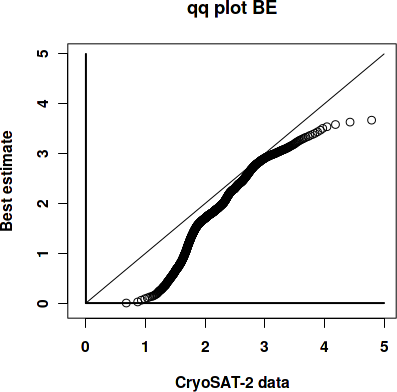
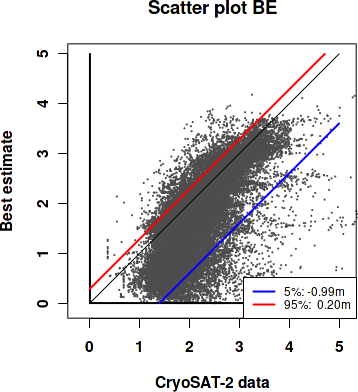
Best estimate vs. observations
Contingency table
| observations | |||||||||
|---|---|---|---|---|---|---|---|---|---|
| open | c1 | c2 | c3 | c4 | c5 | c6 | |||
| m o d e l |
open | 0 | 0 | 0 | 0.001 | 0.001 | 0 | 0 | |
| c1 | 0 | 0.004 | 0.046 | 0.085 | 0.024 | 0.006 | 0.003 | ||
| c2 | 0 | 0 | 0.018 | 0.072 | 0.026 | 0.007 | 0.002 | ||
| c3 | 0 | 0 | 0.011 | 0.16 | 0.141 | 0.016 | 0.004 | ||
| c4 | 0 | 0 | 0.001 | 0.019 | 0.095 | 0.052 | 0.007 | ||
| c5 | 0 | 0 | 0 | 0.002 | 0.023 | 0.088 | 0.029 | ||
| c6 | 0 | 0 | 0 | 0 | 0.002 | 0.013 | 0.043 | ||
See category definitions for details.
Statistical distribution
|
|
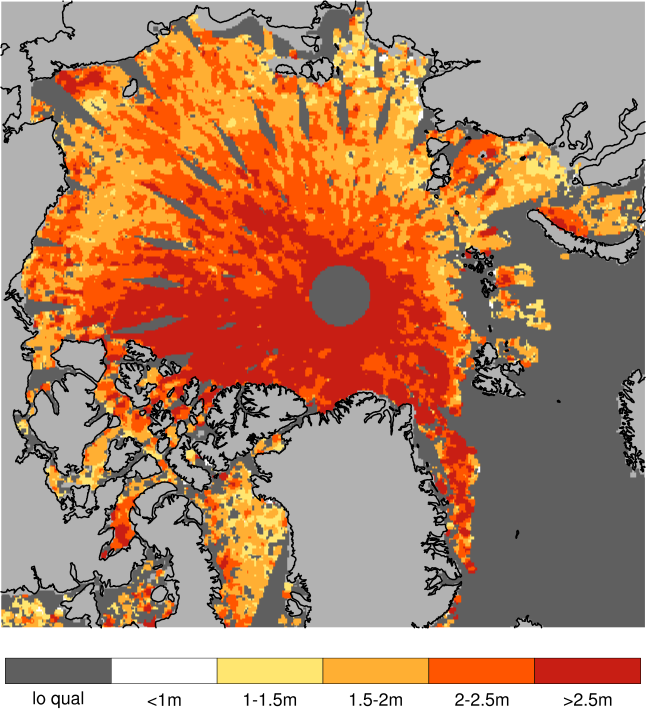
Observed sea ice thickness from CryoSAT
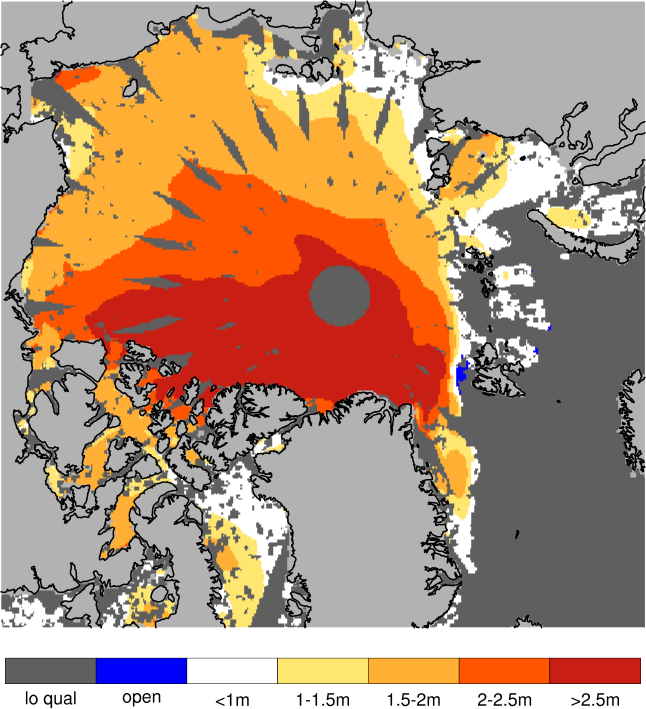
Sea ice thickness, best estimate product
Day 1 forecast vs. observations
Contingency table
| observations | |||||||||
|---|---|---|---|---|---|---|---|---|---|
| open | c1 | c2 | c3 | c4 | c5 | c6 | |||
| m o d e l |
open | 0 | 0 | 0 | 0.001 | 0.001 | 0 | 0 | |
| c1 | 0 | 0.004 | 0.045 | 0.081 | 0.023 | 0.006 | 0.003 | ||
| c2 | 0 | 0 | 0.019 | 0.078 | 0.028 | 0.007 | 0.003 | ||
| c3 | 0 | 0 | 0.011 | 0.157 | 0.141 | 0.016 | 0.004 | ||
| c4 | 0 | 0 | 0.001 | 0.018 | 0.095 | 0.057 | 0.007 | ||
| c5 | 0 | 0 | 0 | 0.002 | 0.021 | 0.084 | 0.035 | ||
| c6 | 0 | 0 | 0 | 0 | 0.002 | 0.011 | 0.036 | ||
See category definitions for details.
Statistical distribution
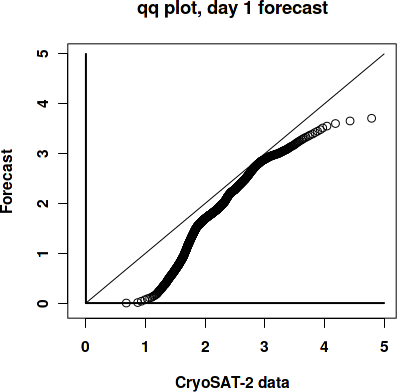
|
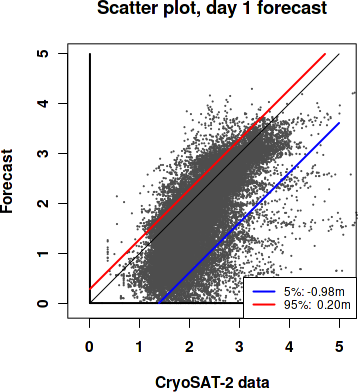
|
Sea ice thickness, day 1 forecast

Day 7 forecast vs. observations
Contingency table
| observations | |||||||||
|---|---|---|---|---|---|---|---|---|---|
| open | c1 | c2 | c3 | c4 | c5 | c6 | |||
| m o d e l |
open | 0 | 0 | 0 | 0.001 | 0.001 | 0 | 0 | |
| c1 | 0 | 0.004 | 0.044 | 0.077 | 0.022 | 0.006 | 0.003 | ||
| c2 | 0 | 0 | 0.02 | 0.082 | 0.029 | 0.008 | 0.003 | ||
| c3 | 0 | 0 | 0.011 | 0.155 | 0.139 | 0.015 | 0.004 | ||
| c4 | 0 | 0 | 0.001 | 0.019 | 0.096 | 0.06 | 0.007 | ||
| c5 | 0 | 0 | 0 | 0.002 | 0.021 | 0.082 | 0.036 | ||
| c6 | 0 | 0 | 0 | 0 | 0.002 | 0.011 | 0.035 | ||
See category definitions for details.
Statistical distribution
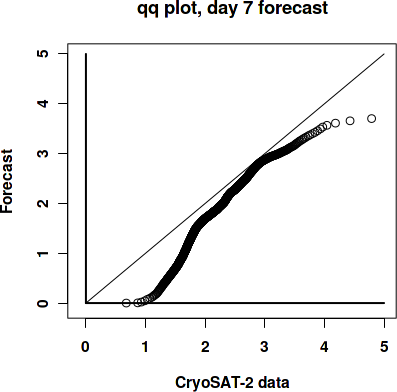
|

|
Sea ice thickness, day 7 forecast

Generated by /metno/routine/sms/V2/SIthickness/c2iceWebPage.sh Fri 15 Apr 2022 02:10:18 AM UTC on arcval