Validation of ice thickness - Full domain
Bulletin date: 2022-03-03
Model: ARC MFC - TOPAZ
Data source: UCL CryoSAT-2 sea ice thickness
Validation statistics summary
| Bias (m) | RMS (m) | total grids | low SIT | OK SIT | high SIT | |
|---|---|---|---|---|---|---|
| Best estimate | -0.4 | 0.69 | 52365 | 7991 | 44234 | 140 |
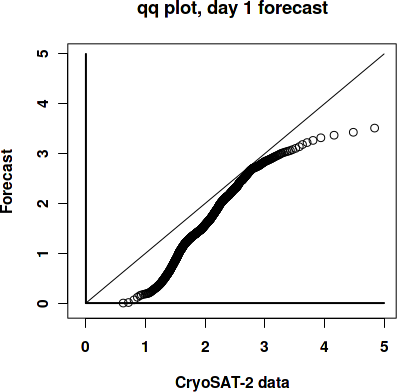
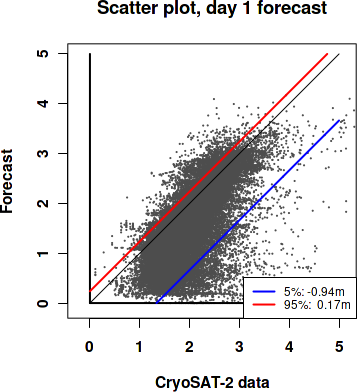
| Day 1 forecast | -0.42 | 0.7 | 52365 | 8271 | 43946 | 148 |
| Day 4 forecast | -0.43 | 0.71 | 52365 | 8484 | 43738 | 143 |
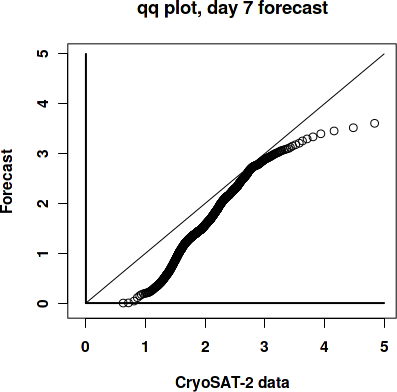
| Day 7 forecast | -0.41 | 0.71 | 52365 | 8167 | 44035 | 163 |
| Day 10 forecast | -0.44 | 0.73 | 52365 | 8793 | 43414 | 158 |
Numbers in the three rightmost columns are grid counts. Regions with high/low sea ice thickness correspond to areas with model offsets from the gridded observations outside of one standard deviation. (Standard deviations are provided in the observational product.)
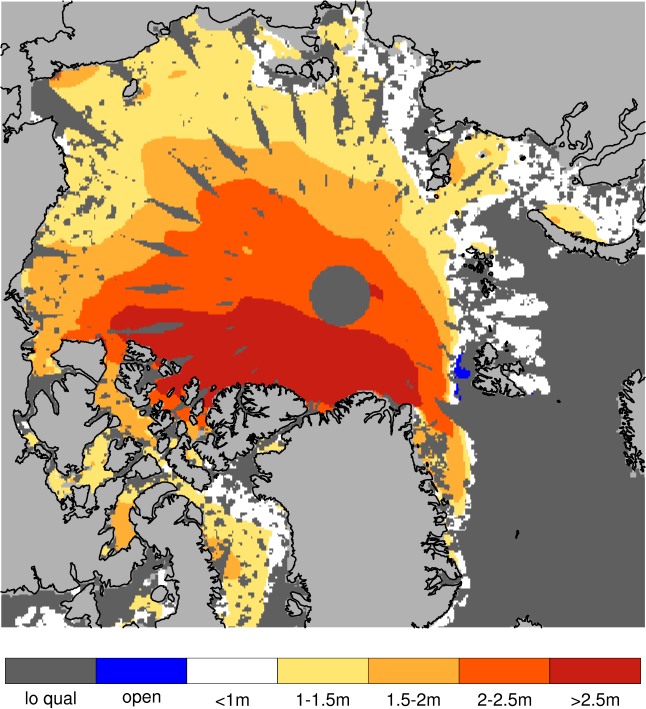
Definition of categories:
| Category | Sea ice thickness |
|---|---|
| c1 | <1m |
| c2 | 1 - 1.5m |
| c3 | 1.5 - 2m |
| c4 | 2 - 2.5m |
| c5 | 2.5 - 3m |
| c6 | >3m |
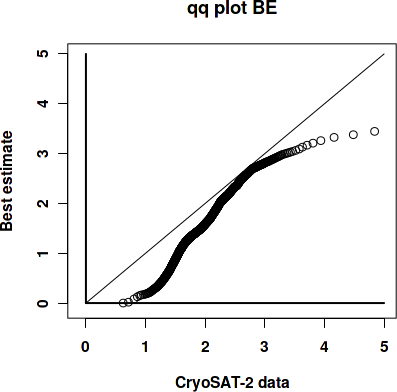
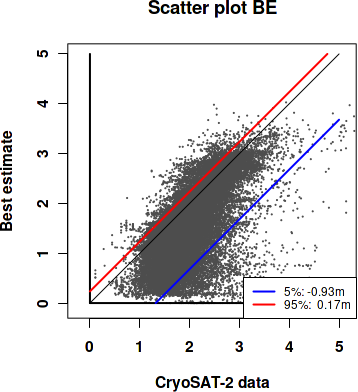
Best estimate vs. observations
Contingency table
| observations | |||||||||
|---|---|---|---|---|---|---|---|---|---|
| open | c1 | c2 | c3 | c4 | c5 | c6 | |||
| m o d e l |
open | 0 | 0 | 0 | 0 | 0.001 | 0 | 0 | |
| c1 | 0 | 0.006 | 0.059 | 0.07 | 0.022 | 0.007 | 0.005 | ||
| c2 | 0 | 0.001 | 0.063 | 0.189 | 0.045 | 0.005 | 0.001 | ||
| c3 | 0 | 0.001 | 0.007 | 0.105 | 0.078 | 0.009 | 0.002 | ||
| c4 | 0 | 0 | 0.001 | 0.02 | 0.113 | 0.047 | 0.003 | ||
| c5 | 0 | 0 | 0 | 0.003 | 0.025 | 0.077 | 0.019 | ||
| c6 | 0 | 0 | 0 | 0 | 0.001 | 0.004 | 0.008 | ||
See category definitions for details.
Statistical distribution
|
|
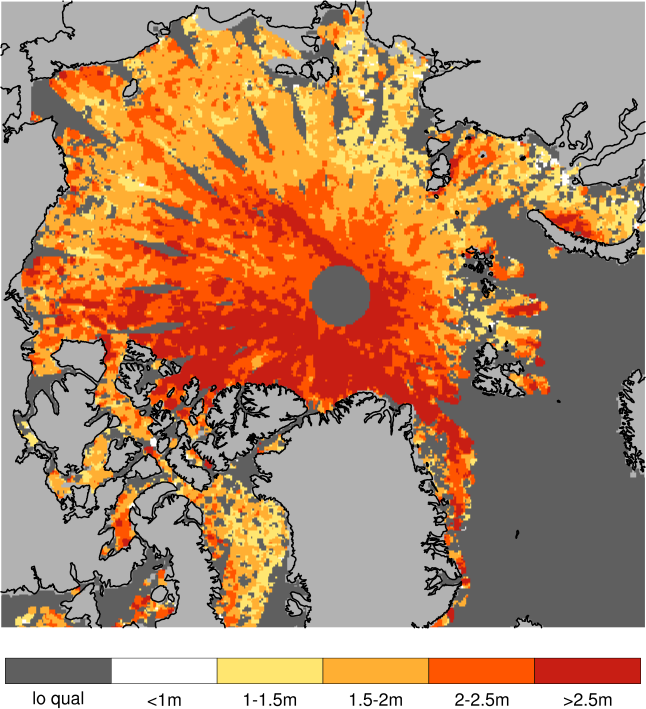
Observed sea ice thickness from CryoSAT
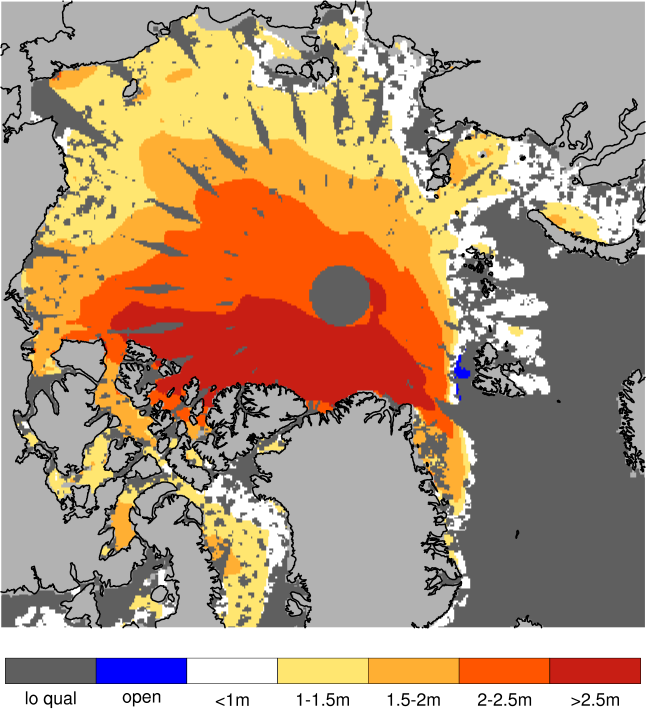
Sea ice thickness, best estimate product
Day 1 forecast vs. observations
Contingency table
| observations | |||||||||
|---|---|---|---|---|---|---|---|---|---|
| open | c1 | c2 | c3 | c4 | c5 | c6 | |||
| m o d e l |
open | 0 | 0 | 0 | 0 | 0.001 | 0 | 0 | |
| c1 | 0 | 0.006 | 0.061 | 0.073 | 0.022 | 0.006 | 0.005 | ||
| c2 | 0 | 0.001 | 0.061 | 0.194 | 0.048 | 0.006 | 0.001 | ||
| c3 | 0 | 0.001 | 0.007 | 0.099 | 0.082 | 0.01 | 0.002 | ||
| c4 | 0 | 0 | 0 | 0.019 | 0.109 | 0.052 | 0.004 | ||
| c5 | 0 | 0 | 0 | 0.003 | 0.023 | 0.069 | 0.017 | ||
| c6 | 0 | 0 | 0 | 0 | 0.001 | 0.006 | 0.009 | ||
See category definitions for details.
Statistical distribution
|
|
Sea ice thickness, day 1 forecast
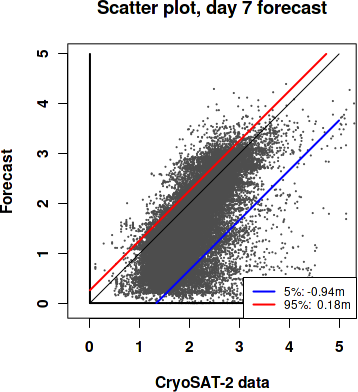
Day 7 forecast vs. observations
Contingency table
| observations | |||||||||
|---|---|---|---|---|---|---|---|---|---|
| open | c1 | c2 | c3 | c4 | c5 | c6 | |||
| m o d e l |
open | 0 | 0 | 0 | 0 | 0.001 | 0 | 0 | |
| c1 | 0 | 0.006 | 0.062 | 0.072 | 0.022 | 0.006 | 0.005 | ||
| c2 | 0 | 0.001 | 0.061 | 0.194 | 0.048 | 0.007 | 0.002 | ||
| c3 | 0 | 0.001 | 0.007 | 0.1 | 0.084 | 0.01 | 0.002 | ||
| c4 | 0 | 0 | 0 | 0.018 | 0.104 | 0.052 | 0.004 | ||
| c5 | 0 | 0 | 0 | 0.003 | 0.024 | 0.066 | 0.015 | ||
| c6 | 0 | 0 | 0 | 0 | 0.002 | 0.009 | 0.011 | ||
See category definitions for details.
Statistical distribution
|
|
Sea ice thickness, day 7 forecast

Generated by /metno/routine/sms/V2/SIthickness/c2iceWebPage.sh Fri 18 Mar 2022 02:18:27 AM UTC on arcval