Validation of ice thickness - Full domain
Bulletin date: 2022-02-17
Model: ARC MFC - TOPAZ
Data source: UCL CryoSAT-2 sea ice thickness
Validation statistics summary
| Bias (m) | RMS (m) | total grids | low SIT | OK SIT | high SIT | |
|---|---|---|---|---|---|---|
| Best estimate | -0.37 | 0.61 | 49336 | 7267 | 41970 | 99 |
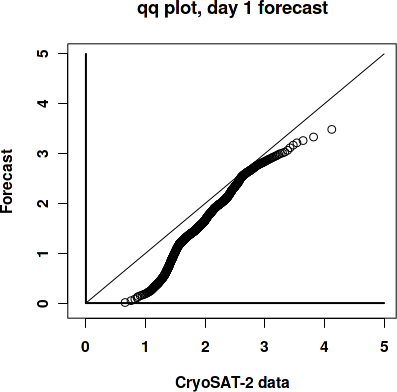
| Day 1 forecast | -0.37 | 0.61 | 49336 | 7396 | 41834 | 106 |
| Day 4 forecast | -0.38 | 0.62 | 49336 | 7482 | 41755 | 99 |
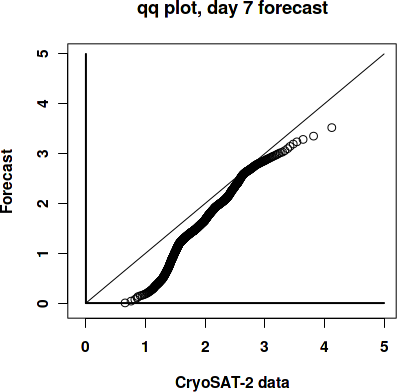
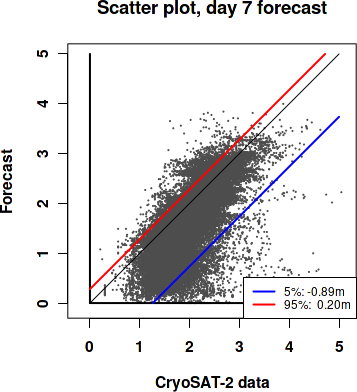
| Day 7 forecast | -0.36 | 0.61 | 49336 | 7411 | 41795 | 130 |
| Day 10 forecast | -0.4 | 0.62 | 49336 | 7254 | 41974 | 108 |
Numbers in the three rightmost columns are grid counts. Regions with high/low sea ice thickness correspond to areas with model offsets from the gridded observations outside of one standard deviation. (Standard deviations are provided in the observational product.)
Definition of categories:
| Category | Sea ice thickness |
|---|---|
| c1 | <1m |
| c2 | 1 - 1.5m |
| c3 | 1.5 - 2m |
| c4 | 2 - 2.5m |
| c5 | 2.5 - 3m |
| c6 | >3m |
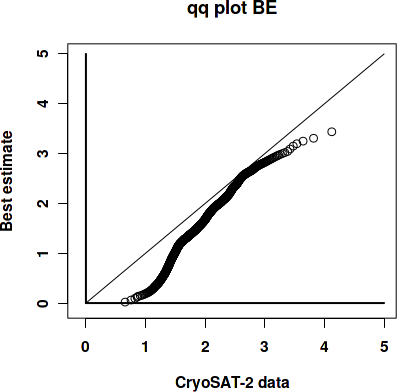
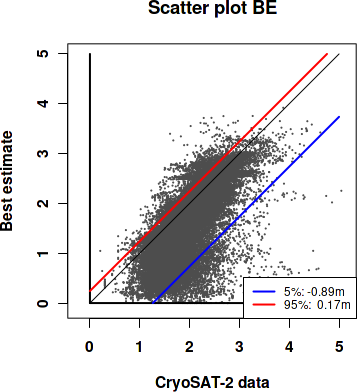
Best estimate vs. observations
Contingency table
| observations | |||||||||
|---|---|---|---|---|---|---|---|---|---|
| open | c1 | c2 | c3 | c4 | c5 | c6 | |||
| m o d e l |
open | 0 | 0 | 0 | 0 | 0 | 0 | 0 | |
| c1 | 0 | 0.007 | 0.076 | 0.083 | 0.022 | 0.004 | 0.002 | ||
| c2 | 0 | 0.002 | 0.111 | 0.181 | 0.024 | 0.003 | 0.001 | ||
| c3 | 0 | 0 | 0.008 | 0.116 | 0.079 | 0.009 | 0.001 | ||
| c4 | 0 | 0 | 0.001 | 0.015 | 0.09 | 0.048 | 0.003 | ||
| c5 | 0 | 0 | 0 | 0.003 | 0.03 | 0.058 | 0.013 | ||
| c6 | 0 | 0 | 0 | 0 | 0.001 | 0.003 | 0.005 | ||
See category definitions for details.
Statistical distribution
|
|
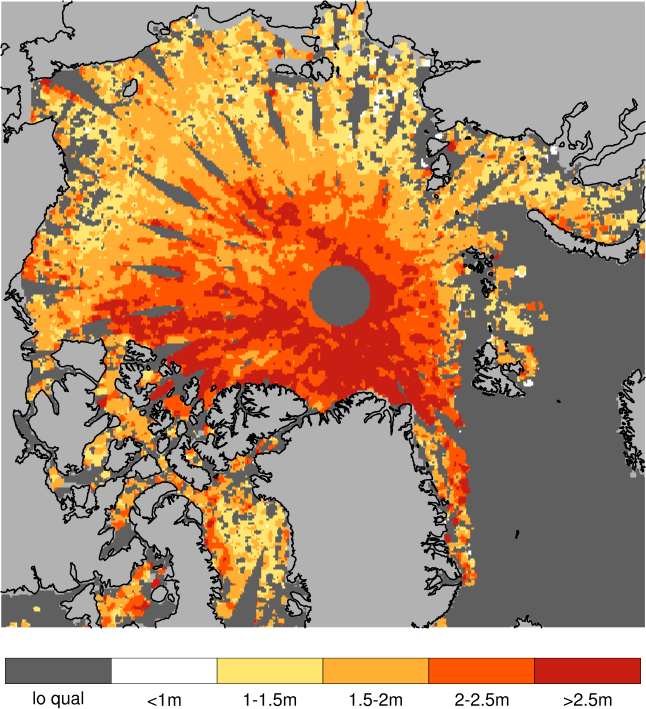
Observed sea ice thickness from CryoSAT
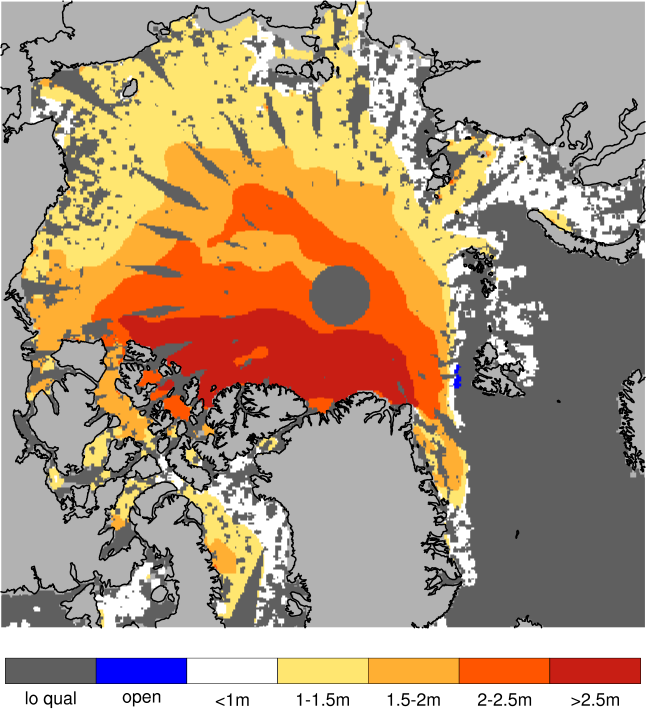
Sea ice thickness, best estimate product
Day 1 forecast vs. observations
Contingency table
| observations | |||||||||
|---|---|---|---|---|---|---|---|---|---|
| open | c1 | c2 | c3 | c4 | c5 | c6 | |||
| m o d e l |
open | 0 | 0 | 0 | 0 | 0.001 | 0 | 0 | |
| c1 | 0 | 0.007 | 0.076 | 0.084 | 0.022 | 0.004 | 0.002 | ||
| c2 | 0 | 0.002 | 0.11 | 0.183 | 0.025 | 0.004 | 0.001 | ||
| c3 | 0 | 0 | 0.009 | 0.114 | 0.085 | 0.01 | 0.001 | ||
| c4 | 0 | 0 | 0.001 | 0.013 | 0.081 | 0.049 | 0.003 | ||
| c5 | 0 | 0 | 0 | 0.004 | 0.031 | 0.056 | 0.012 | ||
| c6 | 0 | 0 | 0 | 0 | 0.001 | 0.003 | 0.006 | ||
See category definitions for details.
Statistical distribution
|

|
Sea ice thickness, day 1 forecast

Day 7 forecast vs. observations
Contingency table
| observations | |||||||||
|---|---|---|---|---|---|---|---|---|---|
| open | c1 | c2 | c3 | c4 | c5 | c6 | |||
| m o d e l |
open | 0 | 0 | 0 | 0 | 0.001 | 0 | 0 | |
| c1 | 0 | 0.007 | 0.076 | 0.083 | 0.021 | 0.004 | 0.002 | ||
| c2 | 0 | 0.002 | 0.108 | 0.177 | 0.026 | 0.004 | 0.001 | ||
| c3 | 0 | 0 | 0.011 | 0.118 | 0.084 | 0.01 | 0.001 | ||
| c4 | 0 | 0 | 0.001 | 0.015 | 0.081 | 0.048 | 0.003 | ||
| c5 | 0 | 0 | 0 | 0.004 | 0.032 | 0.056 | 0.012 | ||
| c6 | 0 | 0 | 0 | 0 | 0.001 | 0.004 | 0.006 | ||
See category definitions for details.
Statistical distribution
|
|
Sea ice thickness, day 7 forecast

Generated by /metno/routine/sms/V2/SIthickness/c2iceWebPage.sh ma. 07. mars 08:15:32 +0000 2022 on arcval