Validation of ice thickness - Full domain
Bulletin date: 2022-02-10
Model: ARC MFC - TOPAZ
Data source: UCL CryoSAT-2 sea ice thickness
Validation statistics summary
| Bias (m) | RMS (m) | total grids | low SIT | OK SIT | high SIT | |
|---|---|---|---|---|---|---|
| Best estimate | -0.38 | 0.64 | 49240 | 6977 | 42136 | 127 |
| Day 1 forecast | -0.38 | 0.63 | 49240 | 6875 | 42236 | 129 |
| Day 4 forecast | -0.39 | 0.64 | 49240 | 6906 | 42205 | 129 |
| Day 7 forecast | -0.37 | 0.63 | 49240 | 6733 | 42368 | 139 |
| Day 10 forecast | -0.4 | 0.64 | 49240 | 6819 | 42281 | 140 |
Numbers in the three rightmost columns are grid counts. Regions with high/low sea ice thickness correspond to areas with model offsets from the gridded observations outside of one standard deviation. (Standard deviations are provided in the observational product.)
Definition of categories:
| Category | Sea ice thickness |
|---|---|
| c1 | <1m |
| c2 | 1 - 1.5m |
| c3 | 1.5 - 2m |
| c4 | 2 - 2.5m |
| c5 | 2.5 - 3m |
| c6 | >3m |
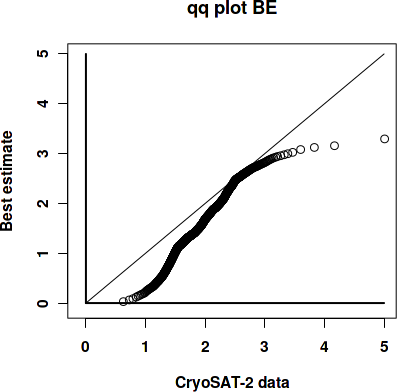
Best estimate vs. observations
Contingency table
| observations | |||||||||
|---|---|---|---|---|---|---|---|---|---|
| open | c1 | c2 | c3 | c4 | c5 | c6 | |||
| m o d e l |
open | 0 | 0 | 0 | 0 | 0 | 0 | 0 | |
| c1 | 0 | 0.007 | 0.078 | 0.079 | 0.022 | 0.005 | 0.005 | ||
| c2 | 0 | 0.004 | 0.108 | 0.205 | 0.028 | 0.003 | 0.001 | ||
| c3 | 0 | 0 | 0.008 | 0.112 | 0.09 | 0.008 | 0.001 | ||
| c4 | 0 | 0 | 0.001 | 0.013 | 0.086 | 0.031 | 0.002 | ||
| c5 | 0 | 0 | 0 | 0.004 | 0.037 | 0.049 | 0.008 | ||
| c6 | 0 | 0 | 0 | 0 | 0.001 | 0.002 | 0.003 | ||
See category definitions for details.
Statistical distribution
|

|
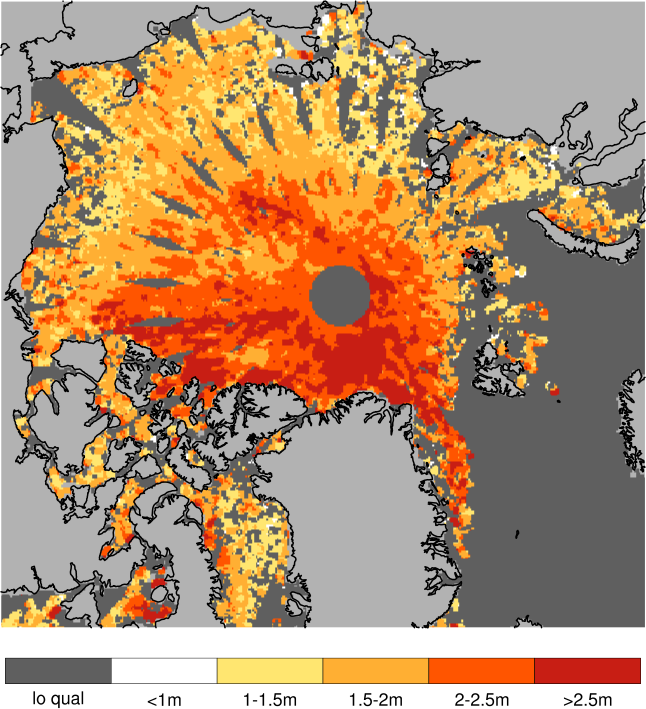
Observed sea ice thickness from CryoSAT
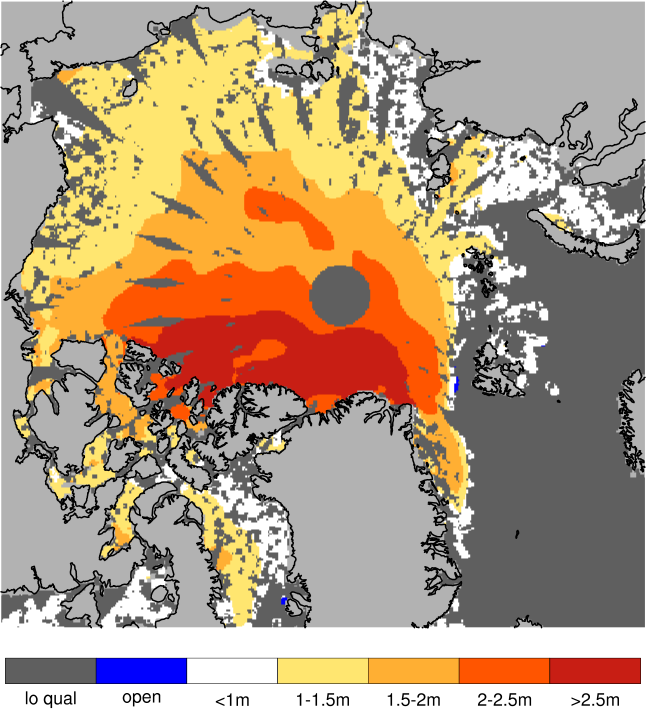
Sea ice thickness, best estimate product
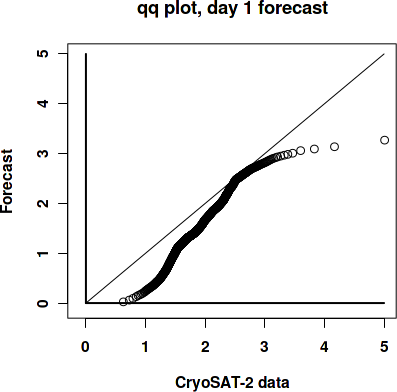
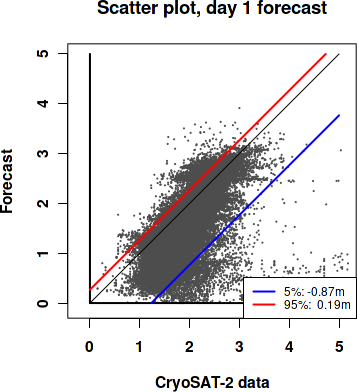
Day 1 forecast vs. observations
Contingency table
| observations | |||||||||
|---|---|---|---|---|---|---|---|---|---|
| open | c1 | c2 | c3 | c4 | c5 | c6 | |||
| m o d e l |
open | 0 | 0 | 0 | 0 | 0 | 0 | 0 | |
| c1 | 0 | 0.007 | 0.079 | 0.08 | 0.021 | 0.005 | 0.005 | ||
| c2 | 0 | 0.004 | 0.106 | 0.207 | 0.029 | 0.003 | 0.001 | ||
| c3 | 0 | 0 | 0.008 | 0.11 | 0.097 | 0.009 | 0.001 | ||
| c4 | 0 | 0 | 0.001 | 0.012 | 0.08 | 0.031 | 0.003 | ||
| c5 | 0 | 0 | 0 | 0.005 | 0.036 | 0.048 | 0.008 | ||
| c6 | 0 | 0 | 0 | 0 | 0.001 | 0.002 | 0.003 | ||
See category definitions for details.
Statistical distribution
|
|
Sea ice thickness, day 1 forecast

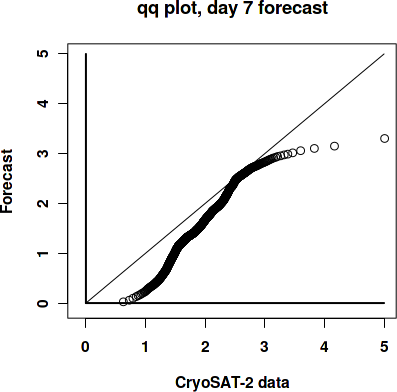
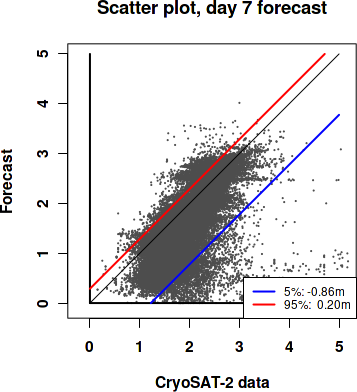
Day 7 forecast vs. observations
Contingency table
| observations | |||||||||
|---|---|---|---|---|---|---|---|---|---|
| open | c1 | c2 | c3 | c4 | c5 | c6 | |||
| m o d e l |
open | 0 | 0 | 0 | 0 | 0 | 0 | 0 | |
| c1 | 0 | 0.007 | 0.078 | 0.08 | 0.021 | 0.004 | 0.004 | ||
| c2 | 0 | 0.004 | 0.106 | 0.203 | 0.029 | 0.003 | 0.001 | ||
| c3 | 0 | 0 | 0.009 | 0.113 | 0.099 | 0.01 | 0.001 | ||
| c4 | 0 | 0 | 0.001 | 0.012 | 0.077 | 0.03 | 0.003 | ||
| c5 | 0 | 0 | 0 | 0.005 | 0.037 | 0.048 | 0.008 | ||
| c6 | 0 | 0 | 0 | 0 | 0.001 | 0.002 | 0.003 | ||
See category definitions for details.
Statistical distribution
|
|
Sea ice thickness, day 7 forecast

Generated by /metno/routine/sms/V2/SIthickness/c2iceWebPage.sh ma. 07. mars 08:11:38 +0000 2022 on arcval