Validation of ice thickness - Full domain
Bulletin date: 2022-01-20
Model: ARC MFC - TOPAZ
Data source: UCL CryoSAT-2 sea ice thickness
Validation statistics summary
| Bias (m) | RMS (m) | total grids | low SIT | OK SIT | high SIT | |
|---|---|---|---|---|---|---|
| Best estimate | -0.38 | 0.63 | 47507 | 7044 | 40363 | 100 |
| Day 1 forecast | -0.39 | 0.63 | 47507 | 7246 | 40149 | 112 |
| Day 4 forecast | -0.39 | 0.64 | 47507 | 7349 | 40041 | 117 |
| Day 7 forecast | -0.38 | 0.63 | 47507 | 7205 | 40159 | 143 |
| Day 10 forecast | -0.4 | 0.65 | 47507 | 7726 | 39628 | 153 |
Numbers in the three rightmost columns are grid counts. Regions with high/low sea ice thickness correspond to areas with model offsets from the gridded observations outside of one standard deviation. (Standard deviations are provided in the observational product.)
Definition of categories:
| Category | Sea ice thickness |
|---|---|
| c1 | <1m |
| c2 | 1 - 1.5m |
| c3 | 1.5 - 2m |
| c4 | 2 - 2.5m |
| c5 | 2.5 - 3m |
| c6 | >3m |
Best estimate vs. observations
Contingency table
| observations | |||||||||
|---|---|---|---|---|---|---|---|---|---|
| open | c1 | c2 | c3 | c4 | c5 | c6 | |||
| m o d e l |
open | 0 | 0 | 0.001 | 0.001 | 0 | 0 | 0 | |
| c1 | 0 | 0.009 | 0.117 | 0.098 | 0.021 | 0.004 | 0.004 | ||
| c2 | 0 | 0.004 | 0.144 | 0.169 | 0.018 | 0.001 | 0 | ||
| c3 | 0 | 0 | 0.008 | 0.117 | 0.079 | 0.005 | 0.001 | ||
| c4 | 0 | 0 | 0 | 0.02 | 0.11 | 0.024 | 0.001 | ||
| c5 | 0 | 0 | 0 | 0.001 | 0.008 | 0.027 | 0.005 | ||
| c6 | 0 | 0 | 0 | 0 | 0.001 | 0.001 | 0.001 | ||
See category definitions for details.
Statistical distribution
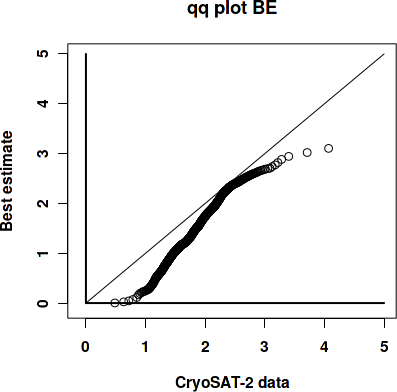
|
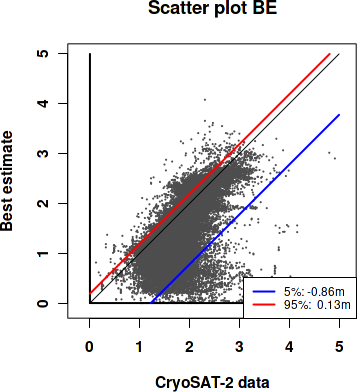
|
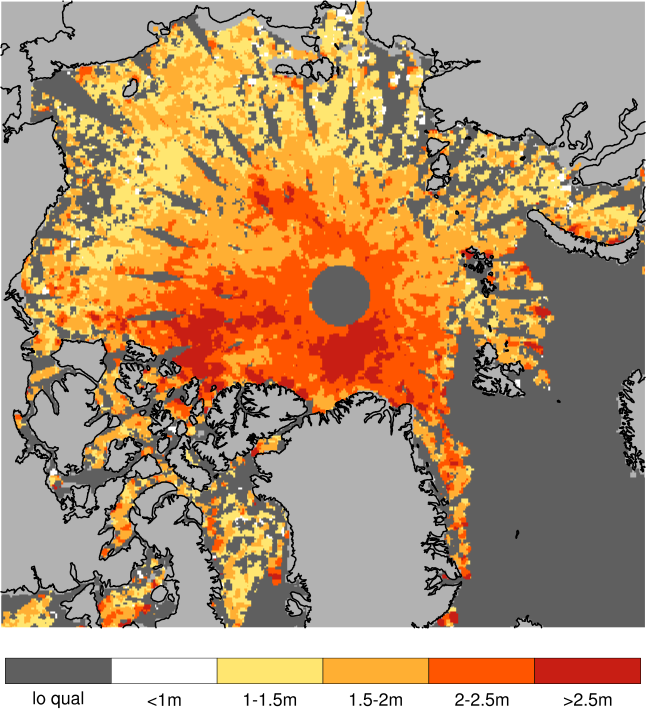
Observed sea ice thickness from CryoSAT
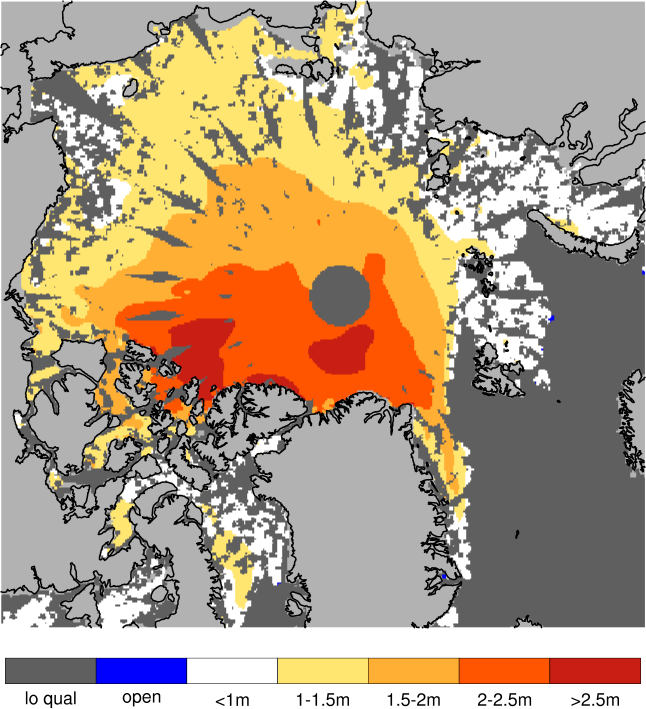
Sea ice thickness, best estimate product
Day 1 forecast vs. observations
Contingency table
| observations | |||||||||
|---|---|---|---|---|---|---|---|---|---|
| open | c1 | c2 | c3 | c4 | c5 | c6 | |||
| m o d e l |
open | 0 | 0 | 0.001 | 0.001 | 0 | 0 | 0 | |
| c1 | 0 | 0.009 | 0.117 | 0.099 | 0.022 | 0.004 | 0.004 | ||
| c2 | 0 | 0.004 | 0.143 | 0.168 | 0.019 | 0.002 | 0 | ||
| c3 | 0 | 0 | 0.009 | 0.116 | 0.08 | 0.005 | 0.001 | ||
| c4 | 0 | 0 | 0 | 0.02 | 0.105 | 0.024 | 0.001 | ||
| c5 | 0 | 0 | 0 | 0.001 | 0.01 | 0.026 | 0.004 | ||
| c6 | 0 | 0 | 0 | 0 | 0.001 | 0.001 | 0.001 | ||
See category definitions for details.
Statistical distribution
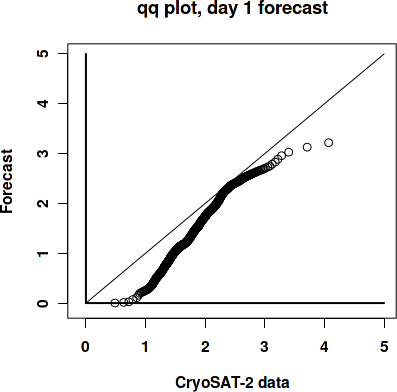
|
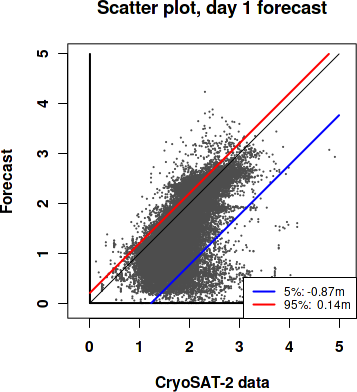
|
Sea ice thickness, day 1 forecast

Day 7 forecast vs. observations
Contingency table
| observations | |||||||||
|---|---|---|---|---|---|---|---|---|---|
| open | c1 | c2 | c3 | c4 | c5 | c6 | |||
| m o d e l |
open | 0 | 0 | 0.001 | 0.001 | 0 | 0 | 0.001 | |
| c1 | 0 | 0.009 | 0.114 | 0.097 | 0.022 | 0.004 | 0.003 | ||
| c2 | 0 | 0.004 | 0.144 | 0.166 | 0.019 | 0.001 | 0 | ||
| c3 | 0 | 0 | 0.011 | 0.119 | 0.082 | 0.005 | 0.001 | ||
| c4 | 0 | 0 | 0 | 0.021 | 0.1 | 0.023 | 0.001 | ||
| c5 | 0 | 0 | 0 | 0.001 | 0.014 | 0.027 | 0.004 | ||
| c6 | 0 | 0 | 0 | 0 | 0.001 | 0.002 | 0.002 | ||
See category definitions for details.
Statistical distribution
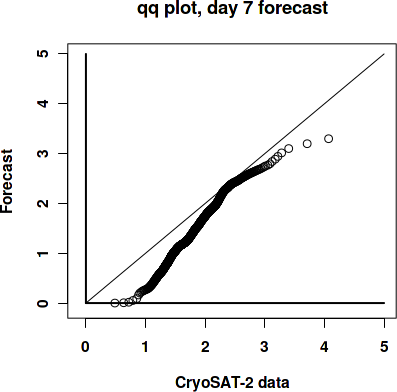
|
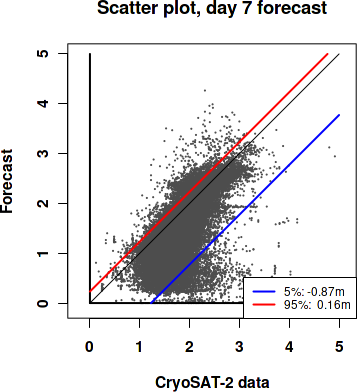
|
Sea ice thickness, day 7 forecast

Generated by /metno/routine/sms/V2/SIthickness/c2iceWebPage.sh Fri 04 Feb 2022 03:51:07 AM UTC on arcval