Validation of ice thickness - Full domain
Bulletin date: 2021-12-09
Model: ARC MFC - TOPAZ
Data source: UCL CryoSAT-2 sea ice thickness
Validation statistics summary
| Bias (m) | RMS (m) | total grids | low SIT | OK SIT | high SIT | |
|---|---|---|---|---|---|---|
| Best estimate | -0.29 | 0.53 | 38353 | 6219 | 31994 | 140 |
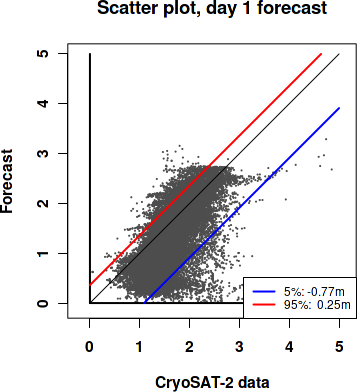
| Day 1 forecast | -0.29 | 0.54 | 38353 | 6288 | 31918 | 147 |
| Day 4 forecast | -0.3 | 0.55 | 38353 | 6491 | 31716 | 146 |
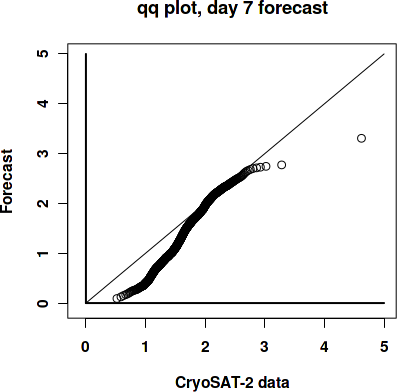
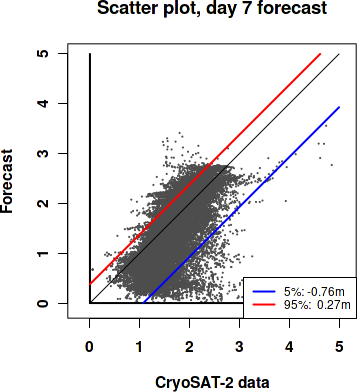
| Day 7 forecast | -0.27 | 0.53 | 38353 | 5970 | 32216 | 167 |
| Day 10 forecast | -0.31 | 0.56 | 38353 | 6934 | 31271 | 148 |
Numbers in the three rightmost columns are grid counts. Regions with high/low sea ice thickness correspond to areas with model offsets from the gridded observations outside of one standard deviation. (Standard deviations are provided in the observational product.)
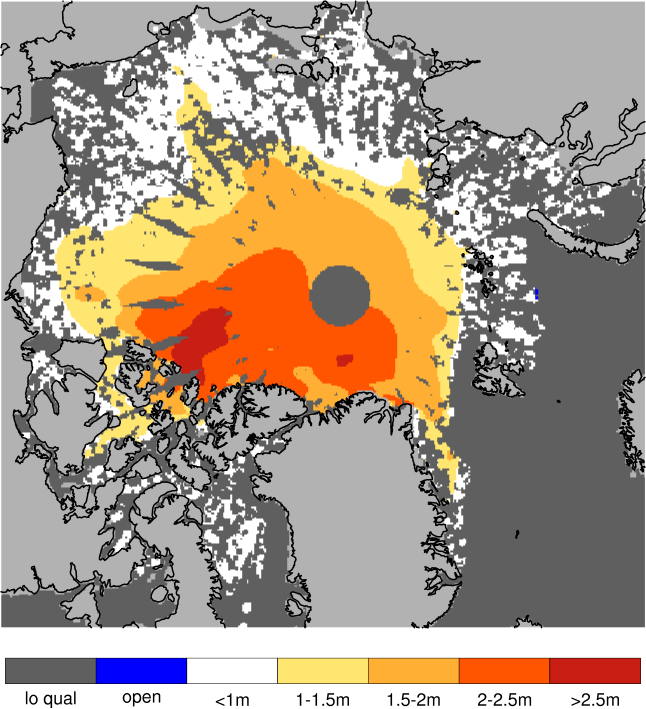
Definition of categories:
| Category | Sea ice thickness |
|---|---|
| c1 | <1m |
| c2 | 1 - 1.5m |
| c3 | 1.5 - 2m |
| c4 | 2 - 2.5m |
| c5 | 2.5 - 3m |
| c6 | >3m |
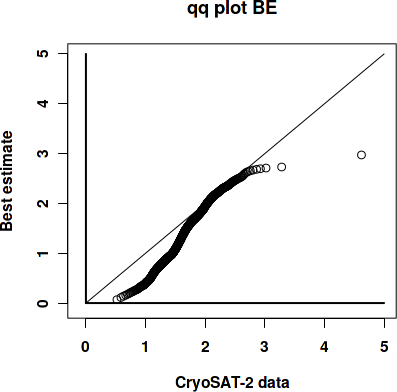
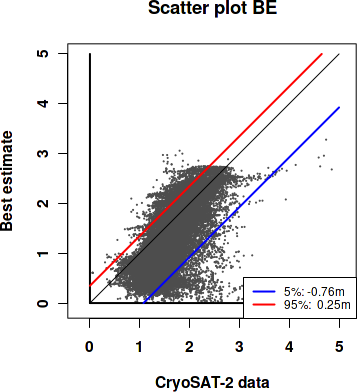
Best estimate vs. observations
Contingency table
| observations | |||||||||
|---|---|---|---|---|---|---|---|---|---|
| open | c1 | c2 | c3 | c4 | c5 | c6 | |||
| m o d e l |
open | 0 | 0 | 0 | 0 | 0 | 0 | 0 | |
| c1 | 0 | 0.053 | 0.237 | 0.067 | 0.01 | 0.002 | 0.001 | ||
| c2 | 0 | 0.001 | 0.088 | 0.099 | 0.012 | 0.002 | 0 | ||
| c3 | 0 | 0 | 0.025 | 0.156 | 0.052 | 0.003 | 0 | ||
| c4 | 0 | 0 | 0.004 | 0.058 | 0.095 | 0.012 | 0.001 | ||
| c5 | 0 | 0 | 0 | 0.003 | 0.011 | 0.007 | 0.001 | ||
| c6 | 0 | 0 | 0 | 0 | 0 | 0 | 0 | ||
See category definitions for details.
Statistical distribution
|
|
Observed sea ice thickness from CryoSAT
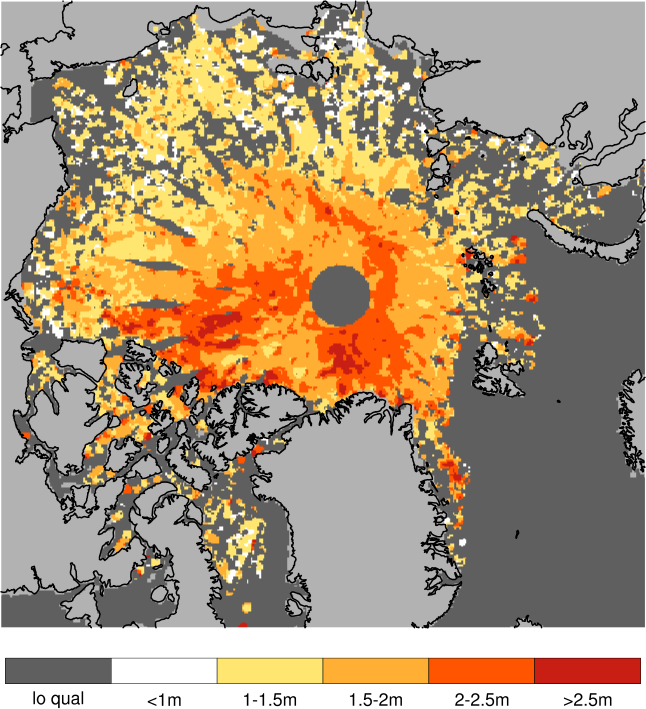
Sea ice thickness, best estimate product

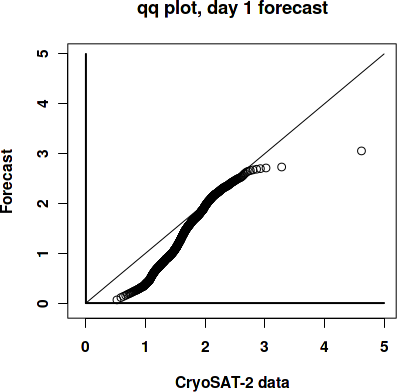
Day 1 forecast vs. observations
Contingency table
| observations | |||||||||
|---|---|---|---|---|---|---|---|---|---|
| open | c1 | c2 | c3 | c4 | c5 | c6 | |||
| m o d e l |
open | 0 | 0 | 0 | 0 | 0 | 0 | 0 | |
| c1 | 0 | 0.052 | 0.231 | 0.065 | 0.01 | 0.003 | 0.001 | ||
| c2 | 0 | 0.001 | 0.093 | 0.102 | 0.012 | 0.002 | 0 | ||
| c3 | 0 | 0 | 0.026 | 0.152 | 0.052 | 0.002 | 0 | ||
| c4 | 0 | 0 | 0.004 | 0.06 | 0.094 | 0.013 | 0.001 | ||
| c5 | 0 | 0 | 0 | 0.003 | 0.012 | 0.007 | 0.001 | ||
| c6 | 0 | 0 | 0 | 0 | 0 | 0 | 0 | ||
See category definitions for details.
Statistical distribution
|
|
Sea ice thickness, day 1 forecast
Day 7 forecast vs. observations
Contingency table
| observations | |||||||||
|---|---|---|---|---|---|---|---|---|---|
| open | c1 | c2 | c3 | c4 | c5 | c6 | |||
| m o d e l |
open | 0 | 0 | 0 | 0 | 0 | 0 | 0 | |
| c1 | 0 | 0.052 | 0.219 | 0.062 | 0.01 | 0.003 | 0.001 | ||
| c2 | 0 | 0.002 | 0.104 | 0.102 | 0.012 | 0.002 | 0 | ||
| c3 | 0 | 0 | 0.026 | 0.153 | 0.053 | 0.002 | 0 | ||
| c4 | 0 | 0 | 0.004 | 0.063 | 0.092 | 0.013 | 0.001 | ||
| c5 | 0 | 0 | 0 | 0.002 | 0.013 | 0.006 | 0.001 | ||
| c6 | 0 | 0 | 0 | 0 | 0 | 0 | 0 | ||
See category definitions for details.
Statistical distribution
|
|
Sea ice thickness, day 7 forecast

Generated by /metno/routine/sms/V2/SIthickness/c2iceWebPage.sh Fri 24 Dec 2021 02:24:03 AM UTC on arcval