Validation of ice thickness - Full domain
Bulletin date: 2021-11-25
Model: ARC MFC - TOPAZ
Data source: UCL CryoSAT-2 sea ice thickness
Validation statistics summary
| Bias (m) | RMS (m) | total grids | low SIT | OK SIT | high SIT | |
|---|---|---|---|---|---|---|
| Best estimate | -0.33 | 0.61 | 36324 | 7806 | 28374 | 144 |
| Day 1 forecast | -0.35 | 0.62 | 36324 | 8044 | 28143 | 137 |
| Day 4 forecast | -0.36 | 0.63 | 36324 | 8344 | 27846 | 134 |
| Day 7 forecast | -0.34 | 0.61 | 36324 | 7759 | 28424 | 141 |
| Day 10 forecast | -0.42 | 0.65 | 36324 | 9660 | 26557 | 107 |
Numbers in the three rightmost columns are grid counts. Regions with high/low sea ice thickness correspond to areas with model offsets from the gridded observations outside of one standard deviation. (Standard deviations are provided in the observational product.)
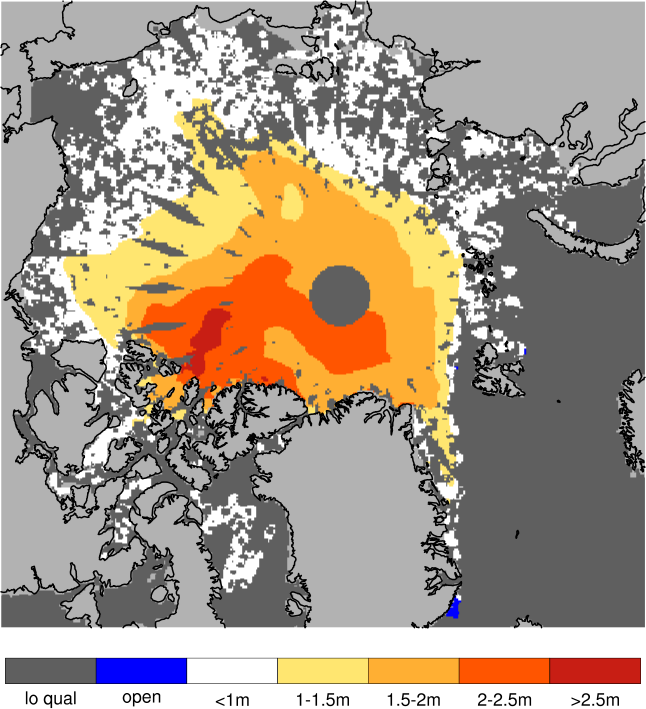
Definition of categories:
| Category | Sea ice thickness |
|---|---|
| c1 | <1m |
| c2 | 1 - 1.5m |
| c3 | 1.5 - 2m |
| c4 | 2 - 2.5m |
| c5 | 2.5 - 3m |
| c6 | >3m |
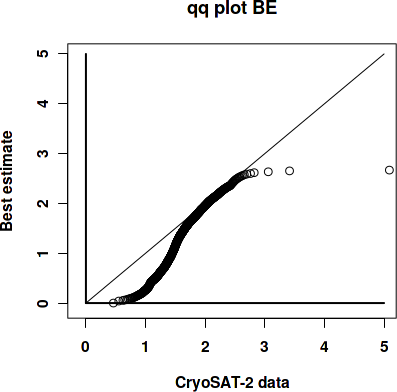
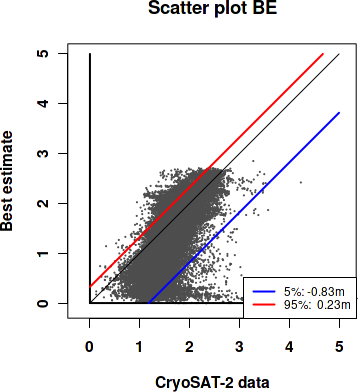
Best estimate vs. observations
Contingency table
| observations | |||||||||
|---|---|---|---|---|---|---|---|---|---|
| open | c1 | c2 | c3 | c4 | c5 | c6 | |||
| m o d e l |
open | 0 | 0 | 0 | 0.001 | 0.001 | 0 | 0 | |
| c1 | 0 | 0.061 | 0.242 | 0.068 | 0.009 | 0.002 | 0.003 | ||
| c2 | 0 | 0.001 | 0.099 | 0.089 | 0.007 | 0.001 | 0 | ||
| c3 | 0 | 0 | 0.029 | 0.175 | 0.043 | 0.002 | 0 | ||
| c4 | 0 | 0 | 0.005 | 0.044 | 0.092 | 0.008 | 0.001 | ||
| c5 | 0 | 0 | 0 | 0.001 | 0.011 | 0.004 | 0 | ||
| c6 | 0 | 0 | 0 | 0 | 0 | 0 | 0 | ||
See category definitions for details.
Statistical distribution
|
|
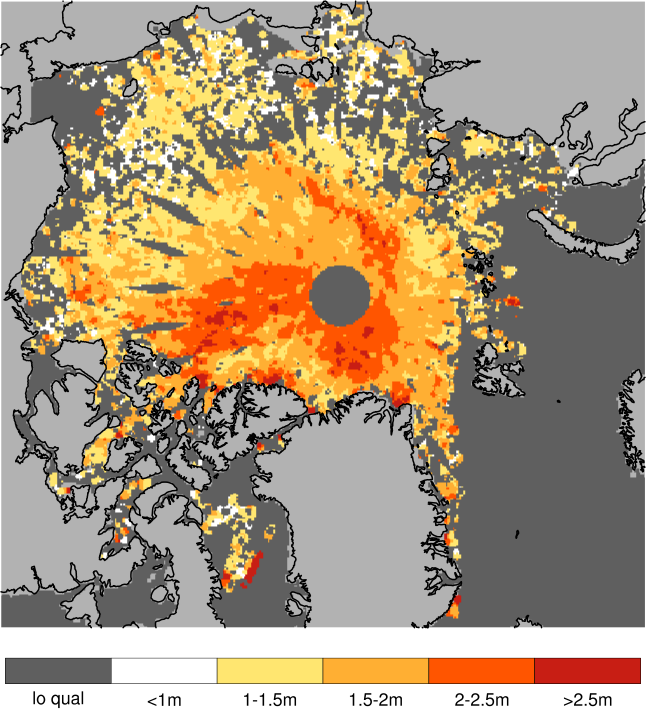
Observed sea ice thickness from CryoSAT
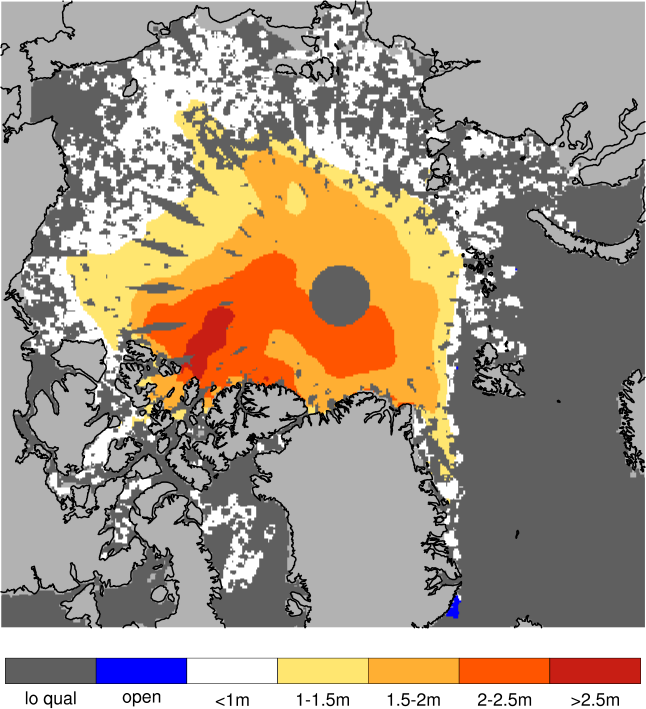
Sea ice thickness, best estimate product
Day 1 forecast vs. observations
Contingency table
| observations | |||||||||
|---|---|---|---|---|---|---|---|---|---|
| open | c1 | c2 | c3 | c4 | c5 | c6 | |||
| m o d e l |
open | 0 | 0 | 0 | 0.001 | 0.001 | 0 | 0 | |
| c1 | 0 | 0.061 | 0.244 | 0.069 | 0.009 | 0.002 | 0.003 | ||
| c2 | 0 | 0.002 | 0.098 | 0.092 | 0.007 | 0.001 | 0 | ||
| c3 | 0 | 0 | 0.028 | 0.174 | 0.049 | 0.002 | 0 | ||
| c4 | 0 | 0 | 0.005 | 0.041 | 0.088 | 0.007 | 0.001 | ||
| c5 | 0 | 0 | 0 | 0.001 | 0.009 | 0.004 | 0 | ||
| c6 | 0 | 0 | 0 | 0 | 0 | 0 | 0 | ||
See category definitions for details.
Statistical distribution
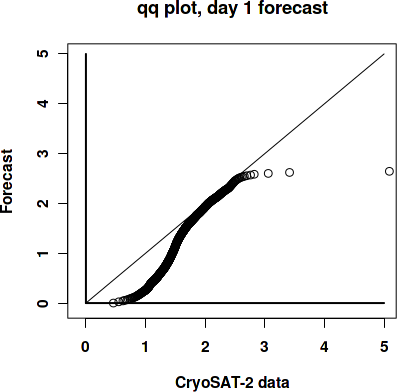
|

|
Sea ice thickness, day 1 forecast

Day 7 forecast vs. observations
Contingency table
| observations | |||||||||
|---|---|---|---|---|---|---|---|---|---|
| open | c1 | c2 | c3 | c4 | c5 | c6 | |||
| m o d e l |
open | 0 | 0 | 0 | 0.001 | 0.001 | 0 | 0 | |
| c1 | 0 | 0.061 | 0.24 | 0.067 | 0.009 | 0.002 | 0.003 | ||
| c2 | 0 | 0.002 | 0.1 | 0.093 | 0.007 | 0.001 | 0 | ||
| c3 | 0 | 0 | 0.03 | 0.175 | 0.051 | 0.002 | 0 | ||
| c4 | 0 | 0 | 0.005 | 0.042 | 0.087 | 0.008 | 0.001 | ||
| c5 | 0 | 0 | 0 | 0.001 | 0.008 | 0.004 | 0 | ||
| c6 | 0 | 0 | 0 | 0 | 0 | 0 | 0 | ||
See category definitions for details.
Statistical distribution

|
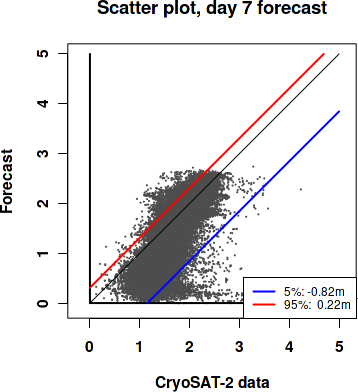
|
Sea ice thickness, day 7 forecast
Generated by /metno/routine/sms/V2/SIthickness/c2iceWebPage.sh Fri 10 Dec 2021 02:21:31 AM UTC on arcval