Validation of ice thickness - Full domain
Bulletin date: 2021-04-29
Model: ARC MFC - TOPAZ
Data source: UCL CryoSAT-2 sea ice thickness
Validation statistics summary
| Bias (m) | RMS (m) | total grids | low SIT | OK SIT | high SIT | |
|---|---|---|---|---|---|---|
| Best estimate | -0.51 | 0.77 | 43858 | 6017 | 37727 | 114 |
| Day 1 forecast | -0.51 | 0.77 | 43858 | 6024 | 37721 | 113 |
| Day 4 forecast | -0.51 | 0.77 | 43858 | 6047 | 37699 | 112 |
| Day 7 forecast | -0.51 | 0.77 | 43858 | 5932 | 37786 | 140 |
| Day 10 forecast | -0.51 | 0.77 | 43858 | 5825 | 37900 | 133 |
Numbers in the three rightmost columns are grid counts. Regions with high/low sea ice thickness correspond to areas with model offsets from the gridded observations outside of one standard deviation. (Standard deviations are provided in the observational product.)
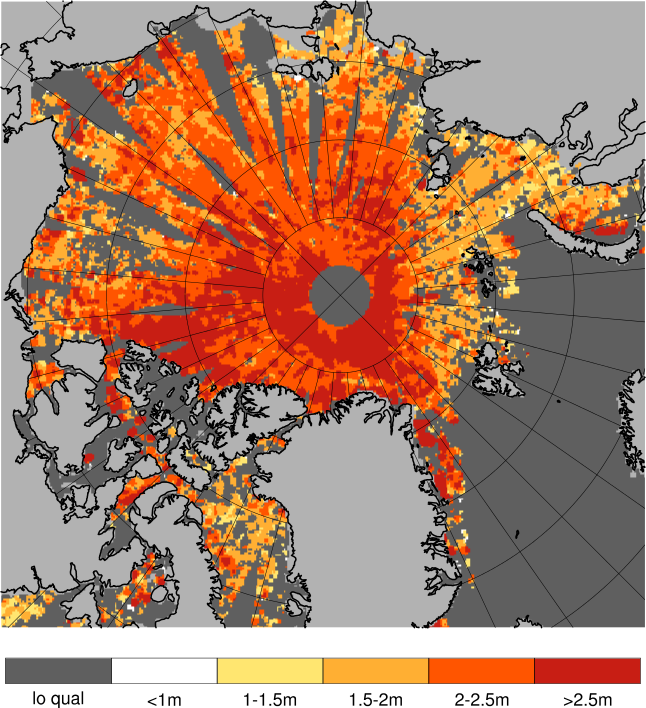
Definition of categories:
| Category | Sea ice thickness |
|---|---|
| c1 | <1m |
| c2 | 1 - 1.5m |
| c3 | 1.5 - 2m |
| c4 | 2 - 2.5m |
| c5 | 2.5 - 3m |
| c6 | >3m |
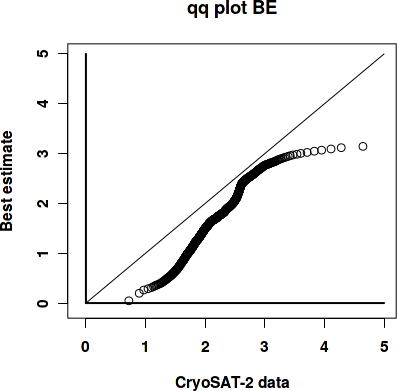
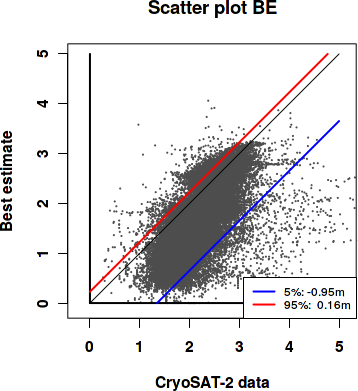
Best estimate vs. observations
Contingency table
| observations | |||||||||
|---|---|---|---|---|---|---|---|---|---|
| open | c1 | c2 | c3 | c4 | c5 | c6 | |||
| m o d e l |
open | 0 | 0 | 0 | 0 | 0 | 0 | 0 | |
| c1 | 0 | 0.002 | 0.03 | 0.073 | 0.023 | 0.004 | 0.003 | ||
| c2 | 0 | 0.001 | 0.014 | 0.105 | 0.055 | 0.011 | 0.006 | ||
| c3 | 0 | 0 | 0.004 | 0.086 | 0.214 | 0.055 | 0.006 | ||
| c4 | 0 | 0 | 0.001 | 0.006 | 0.07 | 0.076 | 0.009 | ||
| c5 | 0 | 0 | 0 | 0.002 | 0.035 | 0.074 | 0.021 | ||
| c6 | 0 | 0 | 0 | 0 | 0.001 | 0.004 | 0.006 | ||
See category definitions for details.
Statistical distribution
|
|
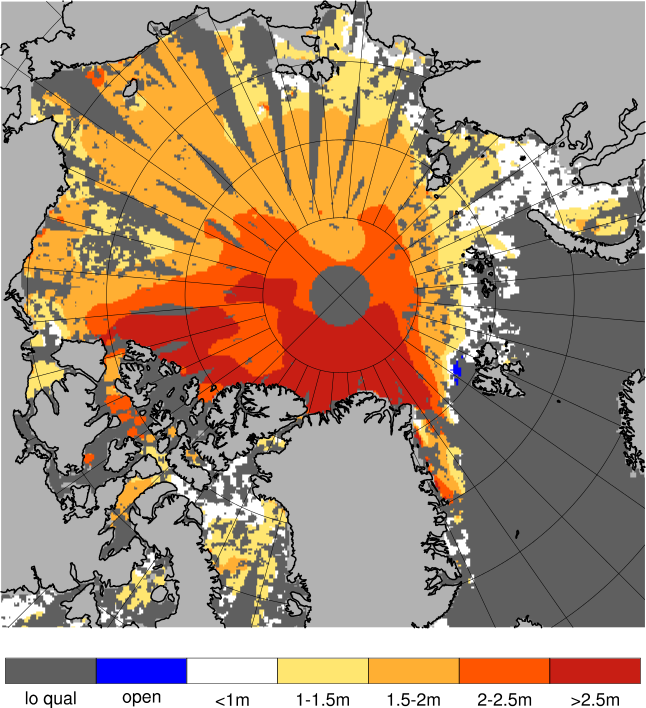
Observed sea ice thickness from CryoSAT
Sea ice thickness, best estimate product

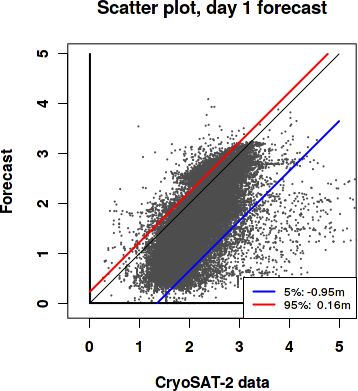
Day 1 forecast vs. observations
Contingency table
| observations | |||||||||
|---|---|---|---|---|---|---|---|---|---|
| open | c1 | c2 | c3 | c4 | c5 | c6 | |||
| m o d e l |
open | 0 | 0 | 0 | 0.001 | 0 | 0 | 0 | |
| c1 | 0 | 0.002 | 0.03 | 0.073 | 0.023 | 0.004 | 0.003 | ||
| c2 | 0 | 0.001 | 0.015 | 0.106 | 0.055 | 0.011 | 0.006 | ||
| c3 | 0 | 0 | 0.004 | 0.086 | 0.215 | 0.055 | 0.006 | ||
| c4 | 0 | 0 | 0 | 0.006 | 0.069 | 0.076 | 0.009 | ||
| c5 | 0 | 0 | 0 | 0.002 | 0.036 | 0.074 | 0.021 | ||
| c6 | 0 | 0 | 0 | 0 | 0.001 | 0.004 | 0.006 | ||
See category definitions for details.
Statistical distribution

|
|
Sea ice thickness, day 1 forecast
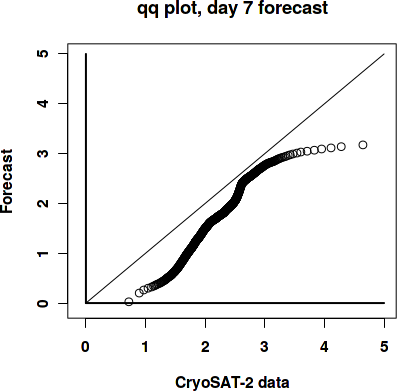
Day 7 forecast vs. observations
Contingency table
| observations | |||||||||
|---|---|---|---|---|---|---|---|---|---|
| open | c1 | c2 | c3 | c4 | c5 | c6 | |||
| m o d e l |
open | 0 | 0 | 0 | 0.001 | 0 | 0 | 0 | |
| c1 | 0 | 0.002 | 0.03 | 0.072 | 0.022 | 0.004 | 0.003 | ||
| c2 | 0 | 0.001 | 0.014 | 0.106 | 0.056 | 0.011 | 0.006 | ||
| c3 | 0 | 0 | 0.004 | 0.086 | 0.216 | 0.057 | 0.006 | ||
| c4 | 0 | 0 | 0.001 | 0.006 | 0.067 | 0.073 | 0.009 | ||
| c5 | 0 | 0 | 0 | 0.002 | 0.036 | 0.073 | 0.021 | ||
| c6 | 0 | 0 | 0 | 0 | 0.001 | 0.005 | 0.006 | ||
See category definitions for details.
Statistical distribution
|

|
Sea ice thickness, day 7 forecast

Generated by /metno/routine/sms/V2/SIthickness/c2iceWebPage.sh Fri May 14 02:06:27 UTC 2021 on arcmfcval