Validation of ice thickness - Full domain
Bulletin date: 2021-03-18
Model: ARC MFC - TOPAZ
Data source: UCL CryoSAT-2 sea ice thickness
Validation statistics summary
| Bias (m) | RMS (m) | total grids | low SIT | OK SIT | high SIT | |
|---|---|---|---|---|---|---|
| Best estimate | -0.5 | 0.72 | 46782 | 7257 | 39420 | 105 |
| Day 1 forecast | -0.52 | 0.73 | 46782 | 7614 | 39065 | 103 |
| Day 4 forecast | -0.53 | 0.74 | 46782 | 7845 | 38836 | 101 |
| Day 7 forecast | -0.51 | 0.73 | 46782 | 7518 | 39157 | 107 |
| Day 10 forecast | -0.54 | 0.75 | 46782 | 8158 | 38515 | 109 |
Numbers in the three rightmost columns are grid counts. Regions with high/low sea ice thickness correspond to areas with model offsets from the gridded observations outside of one standard deviation. (Standard deviations are provided in the observational product.)
Definition of categories:
| Category | Sea ice thickness |
|---|---|
| c1 | <1m |
| c2 | 1 - 1.5m |
| c3 | 1.5 - 2m |
| c4 | 2 - 2.5m |
| c5 | 2.5 - 3m |
| c6 | >3m |
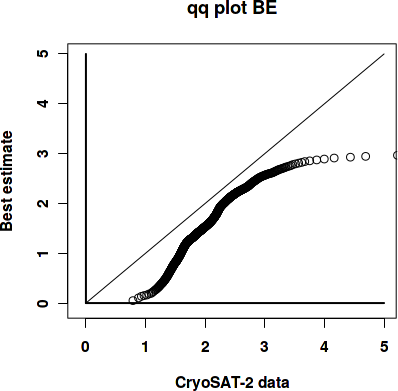
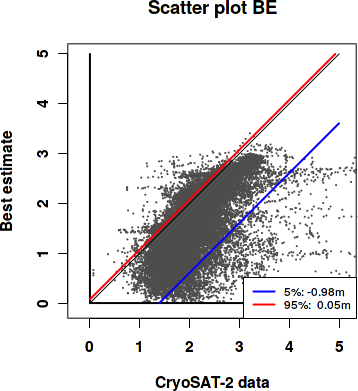
Best estimate vs. observations
Contingency table
| observations | |||||||||
|---|---|---|---|---|---|---|---|---|---|
| open | c1 | c2 | c3 | c4 | c5 | c6 | |||
| m o d e l |
open | 0 | 0 | 0 | 0 | 0 | 0 | 0 | |
| c1 | 0 | 0.003 | 0.058 | 0.091 | 0.022 | 0.006 | 0.005 | ||
| c2 | 0 | 0.001 | 0.048 | 0.214 | 0.057 | 0.011 | 0.004 | ||
| c3 | 0 | 0 | 0.004 | 0.108 | 0.112 | 0.012 | 0.004 | ||
| c4 | 0 | 0 | 0 | 0.015 | 0.105 | 0.052 | 0.009 | ||
| c5 | 0 | 0 | 0 | 0.001 | 0.006 | 0.027 | 0.022 | ||
| c6 | 0 | 0 | 0 | 0 | 0 | 0 | 0.001 | ||
See category definitions for details.
Statistical distribution
|
|
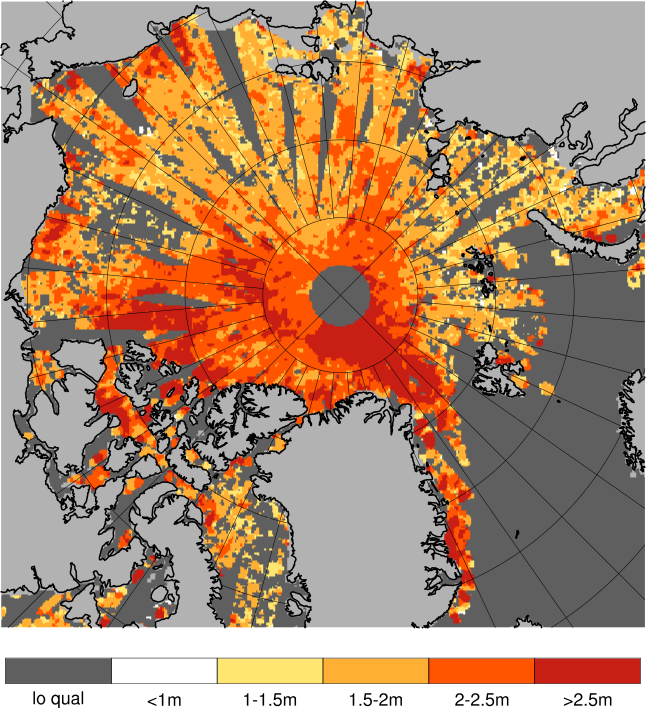
Observed sea ice thickness from CryoSAT
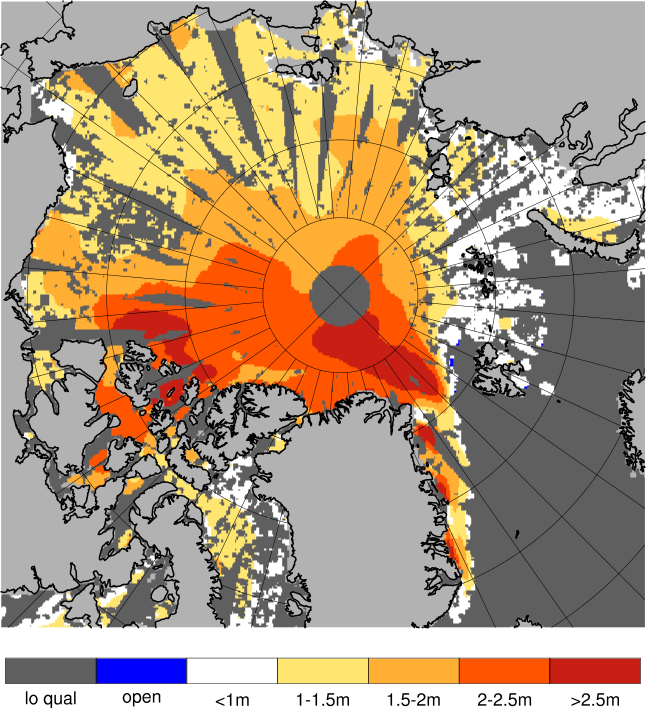
Sea ice thickness, best estimate product
Day 1 forecast vs. observations
Contingency table
| observations | |||||||||
|---|---|---|---|---|---|---|---|---|---|
| open | c1 | c2 | c3 | c4 | c5 | c6 | |||
| m o d e l |
open | 0 | 0 | 0 | 0 | 0 | 0 | 0 | |
| c1 | 0 | 0.003 | 0.058 | 0.094 | 0.023 | 0.006 | 0.005 | ||
| c2 | 0 | 0.001 | 0.047 | 0.22 | 0.059 | 0.01 | 0.004 | ||
| c3 | 0 | 0 | 0.004 | 0.099 | 0.111 | 0.012 | 0.005 | ||
| c4 | 0 | 0 | 0.001 | 0.016 | 0.103 | 0.054 | 0.01 | ||
| c5 | 0 | 0 | 0 | 0.001 | 0.005 | 0.024 | 0.021 | ||
| c6 | 0 | 0 | 0 | 0 | 0 | 0 | 0.001 | ||
See category definitions for details.
Statistical distribution

|

|
Sea ice thickness, day 1 forecast

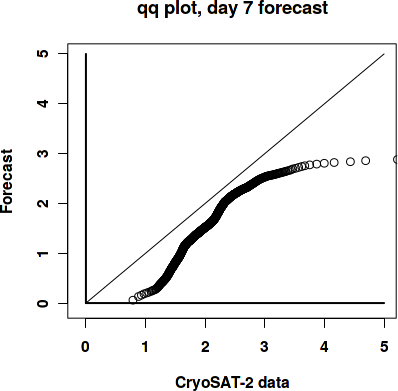
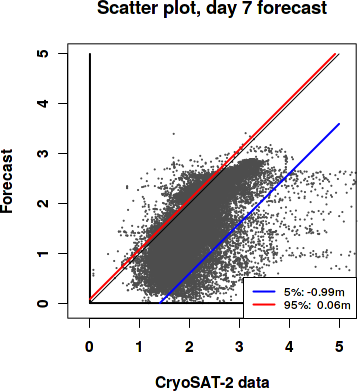
Day 7 forecast vs. observations
Contingency table
| observations | |||||||||
|---|---|---|---|---|---|---|---|---|---|
| open | c1 | c2 | c3 | c4 | c5 | c6 | |||
| m o d e l |
open | 0 | 0 | 0 | 0 | 0 | 0 | 0 | |
| c1 | 0 | 0.003 | 0.057 | 0.093 | 0.023 | 0.006 | 0.005 | ||
| c2 | 0 | 0.001 | 0.048 | 0.216 | 0.061 | 0.01 | 0.005 | ||
| c3 | 0 | 0 | 0.005 | 0.103 | 0.108 | 0.013 | 0.004 | ||
| c4 | 0 | 0 | 0.001 | 0.016 | 0.104 | 0.054 | 0.011 | ||
| c5 | 0 | 0 | 0 | 0.001 | 0.005 | 0.023 | 0.02 | ||
| c6 | 0 | 0 | 0 | 0 | 0 | 0 | 0.001 | ||
See category definitions for details.
Statistical distribution
|
|
Sea ice thickness, day 7 forecast

Generated by /metno/routine/sms/V2/SIthickness/c2iceWebPage.sh Fri Apr 2 02:10:55 UTC 2021 on arcmfcval