Validation of ice thickness - Full domain
Bulletin date: 2021-03-04
Model: ARC MFC - TOPAZ
Data source: UCL CryoSAT-2 sea ice thickness
Validation statistics summary
| Bias (m) | RMS (m) | total grids | low SIT | OK SIT | high SIT | |
|---|---|---|---|---|---|---|
| Best estimate | -0.44 | 0.75 | 39834 | 6072 | 33670 | 92 |
| Day 1 forecast | -0.44 | 0.75 | 39834 | 6030 | 33703 | 101 |
| Day 4 forecast | -0.45 | 0.76 | 39834 | 6095 | 33636 | 103 |
| Day 7 forecast | -0.43 | 0.75 | 39834 | 5869 | 33854 | 111 |
| Day 10 forecast | -0.43 | 0.74 | 39834 | 5782 | 33945 | 107 |
Numbers in the three rightmost columns are grid counts. Regions with high/low sea ice thickness correspond to areas with model offsets from the gridded observations outside of one standard deviation. (Standard deviations are provided in the observational product.)
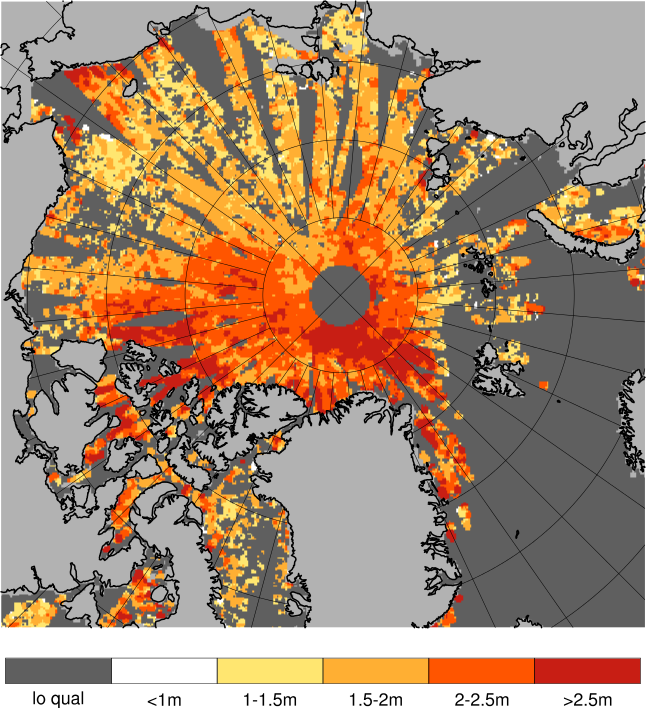
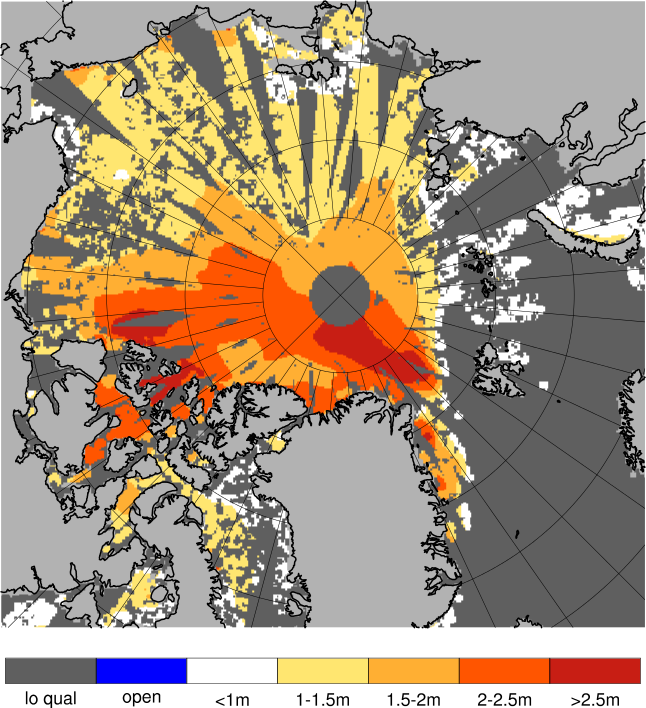
Definition of categories:
| Category | Sea ice thickness |
|---|---|
| c1 | <1m |
| c2 | 1 - 1.5m |
| c3 | 1.5 - 2m |
| c4 | 2 - 2.5m |
| c5 | 2.5 - 3m |
| c6 | >3m |
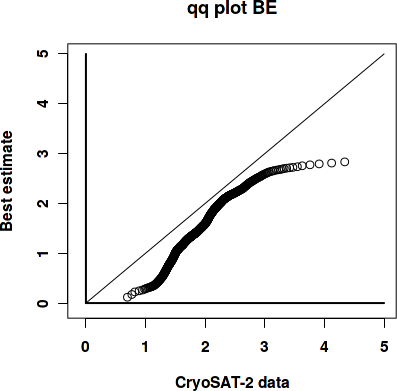
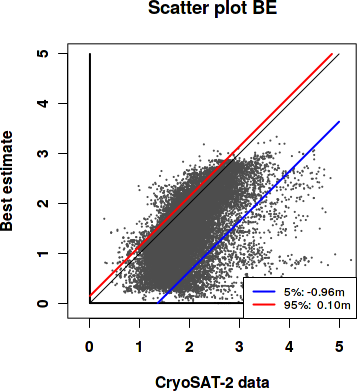
Best estimate vs. observations
Contingency table
| observations | |||||||||
|---|---|---|---|---|---|---|---|---|---|
| open | c1 | c2 | c3 | c4 | c5 | c6 | |||
| m o d e l |
open | 0 | 0 | 0 | 0 | 0 | 0 | 0 | |
| c1 | 0 | 0.006 | 0.058 | 0.079 | 0.021 | 0.005 | 0.006 | ||
| c2 | 0 | 0.003 | 0.1 | 0.216 | 0.049 | 0.006 | 0.003 | ||
| c3 | 0 | 0 | 0.007 | 0.119 | 0.083 | 0.01 | 0.004 | ||
| c4 | 0 | 0 | 0.001 | 0.02 | 0.114 | 0.04 | 0.007 | ||
| c5 | 0 | 0 | 0 | 0 | 0.008 | 0.025 | 0.01 | ||
| c6 | 0 | 0 | 0 | 0 | 0 | 0 | 0 | ||
See category definitions for details.
Statistical distribution
|
|
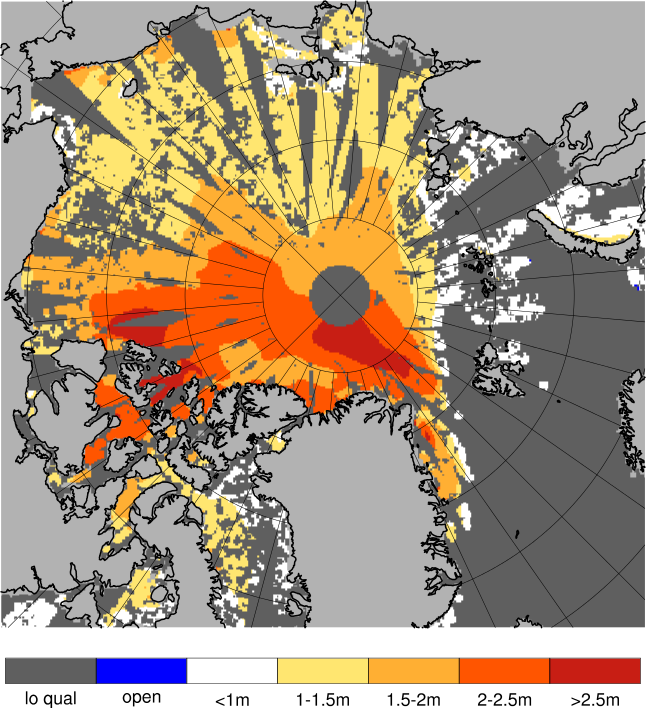
Observed sea ice thickness from CryoSAT
Sea ice thickness, best estimate product
Day 1 forecast vs. observations
Contingency table
| observations | |||||||||
|---|---|---|---|---|---|---|---|---|---|
| open | c1 | c2 | c3 | c4 | c5 | c6 | |||
| m o d e l |
open | 0 | 0 | 0 | 0 | 0 | 0 | 0 | |
| c1 | 0 | 0.006 | 0.058 | 0.078 | 0.022 | 0.004 | 0.006 | ||
| c2 | 0 | 0.003 | 0.099 | 0.213 | 0.047 | 0.006 | 0.004 | ||
| c3 | 0 | 0 | 0.008 | 0.121 | 0.086 | 0.011 | 0.003 | ||
| c4 | 0 | 0 | 0.001 | 0.02 | 0.112 | 0.04 | 0.008 | ||
| c5 | 0 | 0 | 0 | 0 | 0.008 | 0.024 | 0.009 | ||
| c6 | 0 | 0 | 0 | 0 | 0 | 0 | 0 | ||
See category definitions for details.
Statistical distribution
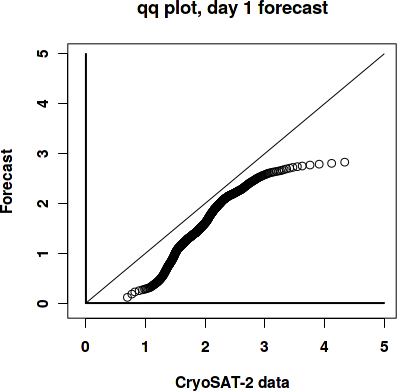
|
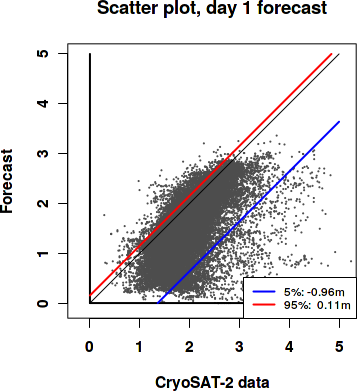
|
Sea ice thickness, day 1 forecast

Day 7 forecast vs. observations
Contingency table
| observations | |||||||||
|---|---|---|---|---|---|---|---|---|---|
| open | c1 | c2 | c3 | c4 | c5 | c6 | |||
| m o d e l |
open | 0 | 0 | 0 | 0 | 0 | 0 | 0 | |
| c1 | 0 | 0.006 | 0.057 | 0.076 | 0.021 | 0.004 | 0.005 | ||
| c2 | 0 | 0.003 | 0.099 | 0.208 | 0.046 | 0.006 | 0.003 | ||
| c3 | 0 | 0 | 0.01 | 0.127 | 0.084 | 0.011 | 0.004 | ||
| c4 | 0 | 0 | 0.001 | 0.022 | 0.116 | 0.041 | 0.008 | ||
| c5 | 0 | 0 | 0 | 0 | 0.008 | 0.023 | 0.009 | ||
| c6 | 0 | 0 | 0 | 0 | 0 | 0 | 0.001 | ||
See category definitions for details.
Statistical distribution

|
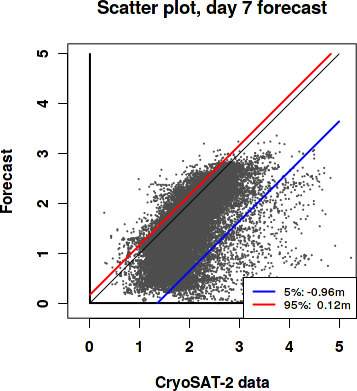
|
Sea ice thickness, day 7 forecast
Generated by /metno/routine/sms/V2/SIthickness/c2iceWebPage.sh Fri Mar 19 02:09:50 UTC 2021 on arcmfcval