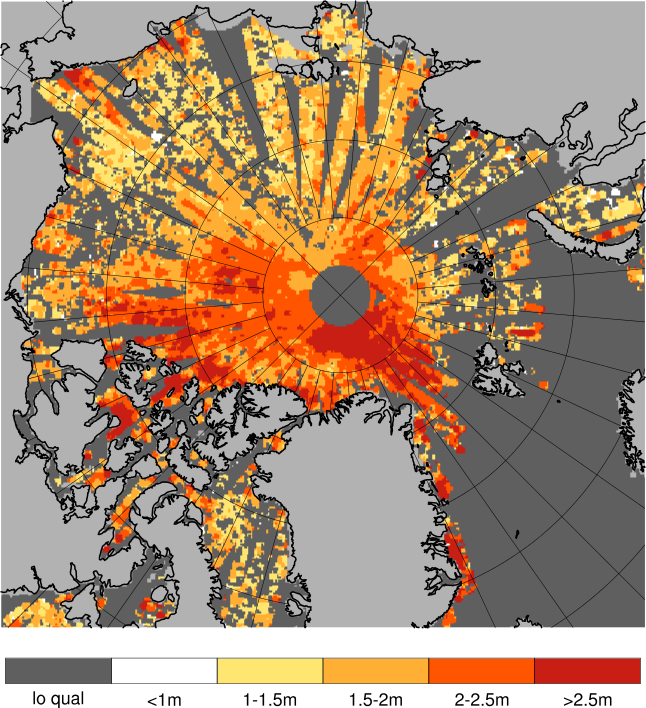
Validation of ice thickness - Full domain
Bulletin date: 2021-02-25
Model: ARC MFC - TOPAZ
Data source: UCL CryoSAT-2 sea ice thickness
Validation statistics summary
| Bias (m) | RMS (m) | total grids | low SIT | OK SIT | high SIT | |
|---|---|---|---|---|---|---|
| Best estimate | -0.43 | 0.69 | 39458 | 6114 | 33200 | 144 |
| Day 1 forecast | -0.42 | 0.69 | 39458 | 5935 | 33369 | 154 |
| Day 4 forecast | -0.43 | 0.69 | 39458 | 6003 | 33291 | 164 |
| Day 7 forecast | -0.41 | 0.68 | 39458 | 5718 | 33563 | 177 |
| Day 10 forecast | -0.41 | 0.7 | 39458 | 5996 | 33195 | 267 |
Numbers in the three rightmost columns are grid counts. Regions with high/low sea ice thickness correspond to areas with model offsets from the gridded observations outside of one standard deviation. (Standard deviations are provided in the observational product.)
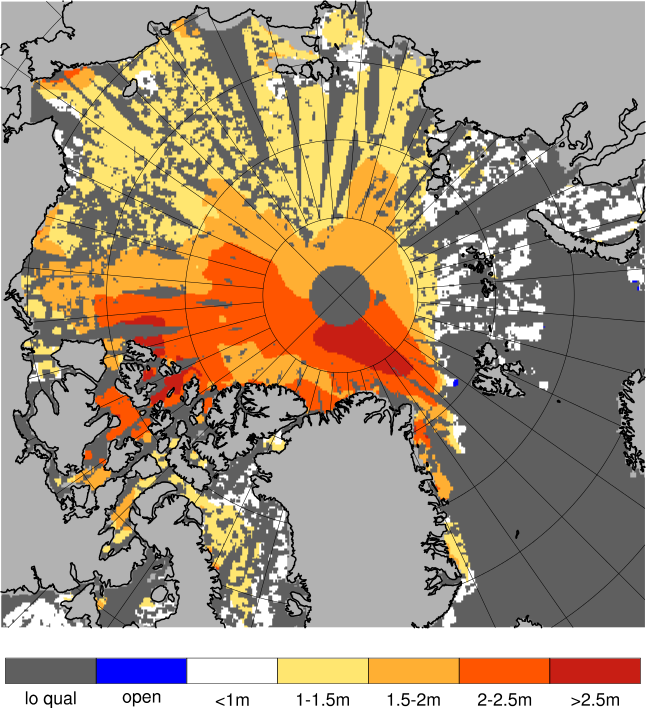
Definition of categories:
| Category | Sea ice thickness |
|---|---|
| c1 | <1m |
| c2 | 1 - 1.5m |
| c3 | 1.5 - 2m |
| c4 | 2 - 2.5m |
| c5 | 2.5 - 3m |
| c6 | >3m |
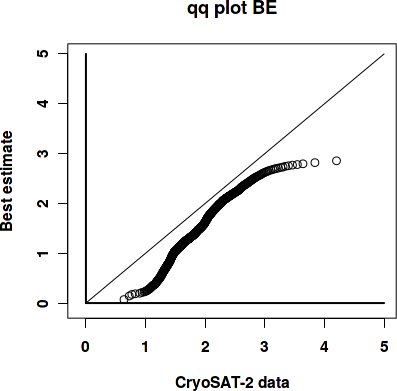
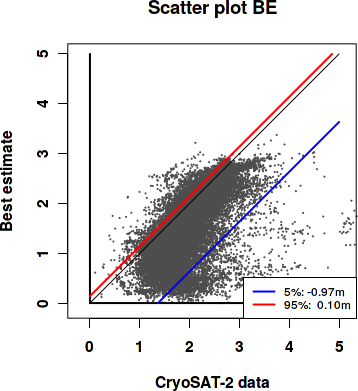
Best estimate vs. observations
Contingency table
| observations | |||||||||
|---|---|---|---|---|---|---|---|---|---|
| open | c1 | c2 | c3 | c4 | c5 | c6 | |||
| m o d e l |
open | 0 | 0 | 0 | 0 | 0 | 0 | 0 | |
| c1 | 0 | 0.007 | 0.073 | 0.08 | 0.023 | 0.006 | 0.004 | ||
| c2 | 0 | 0.004 | 0.125 | 0.206 | 0.035 | 0.005 | 0.003 | ||
| c3 | 0 | 0 | 0.007 | 0.112 | 0.088 | 0.008 | 0.003 | ||
| c4 | 0 | 0 | 0.001 | 0.018 | 0.104 | 0.04 | 0.007 | ||
| c5 | 0 | 0 | 0 | 0.001 | 0.007 | 0.024 | 0.008 | ||
| c6 | 0 | 0 | 0 | 0 | 0 | 0 | 0 | ||
See category definitions for details.
Statistical distribution
|
|
Observed sea ice thickness from CryoSAT
Sea ice thickness, best estimate product

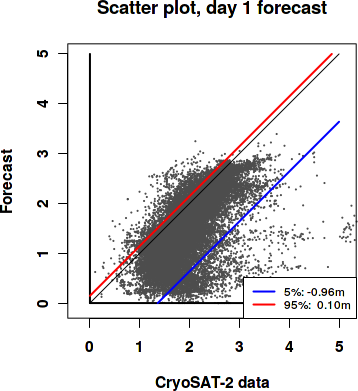
Day 1 forecast vs. observations
Contingency table
| observations | |||||||||
|---|---|---|---|---|---|---|---|---|---|
| open | c1 | c2 | c3 | c4 | c5 | c6 | |||
| m o d e l |
open | 0 | 0 | 0 | 0 | 0 | 0 | 0 | |
| c1 | 0 | 0.007 | 0.07 | 0.078 | 0.022 | 0.005 | 0.004 | ||
| c2 | 0 | 0.004 | 0.127 | 0.201 | 0.034 | 0.005 | 0.004 | ||
| c3 | 0 | 0 | 0.007 | 0.118 | 0.088 | 0.008 | 0.002 | ||
| c4 | 0 | 0 | 0.001 | 0.019 | 0.106 | 0.042 | 0.008 | ||
| c5 | 0 | 0 | 0 | 0.001 | 0.006 | 0.023 | 0.008 | ||
| c6 | 0 | 0 | 0 | 0 | 0 | 0 | 0 | ||
See category definitions for details.
Statistical distribution

|
|
Sea ice thickness, day 1 forecast

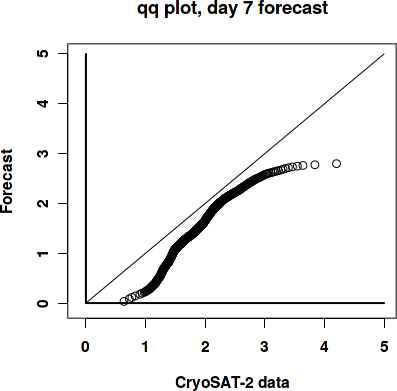
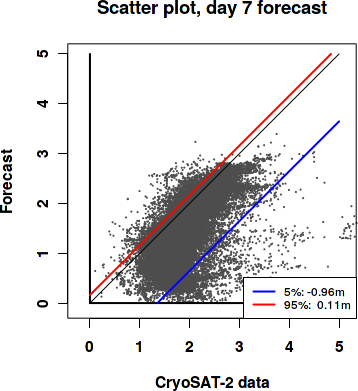
Day 7 forecast vs. observations
Contingency table
| observations | |||||||||
|---|---|---|---|---|---|---|---|---|---|
| open | c1 | c2 | c3 | c4 | c5 | c6 | |||
| m o d e l |
open | 0 | 0 | 0 | 0 | 0 | 0 | 0 | |
| c1 | 0 | 0.007 | 0.067 | 0.076 | 0.022 | 0.005 | 0.004 | ||
| c2 | 0 | 0.003 | 0.128 | 0.193 | 0.032 | 0.005 | 0.004 | ||
| c3 | 0 | 0.001 | 0.01 | 0.125 | 0.084 | 0.009 | 0.002 | ||
| c4 | 0 | 0 | 0.001 | 0.021 | 0.113 | 0.043 | 0.008 | ||
| c5 | 0 | 0 | 0 | 0.001 | 0.005 | 0.021 | 0.008 | ||
| c6 | 0 | 0 | 0 | 0 | 0 | 0 | 0 | ||
See category definitions for details.
Statistical distribution
|
|
Sea ice thickness, day 7 forecast
Generated by /metno/routine/sms/V2/SIthickness/c2iceWebPage.sh Fri Mar 12 02:08:42 UTC 2021 on arcmfcval