Validation of ice thickness - Full domain
Bulletin date: 2021-02-18
Model: ARC MFC - TOPAZ
Data source: UCL CryoSAT-2 sea ice thickness
Validation statistics summary
| Bias (m) | RMS (m) | total grids | low SIT | OK SIT | high SIT | |
|---|---|---|---|---|---|---|
| Best estimate | -0.41 | 0.74 | 39974 | 5653 | 34158 | 163 |
| Day 1 forecast | -0.4 | 0.74 | 39974 | 5619 | 34143 | 212 |
| Day 4 forecast | -0.41 | 0.74 | 39974 | 5701 | 34043 | 230 |
| Day 7 forecast | -0.39 | 0.73 | 39974 | 5526 | 34163 | 285 |
| Day 10 forecast | -0.39 | 0.75 | 39974 | 5740 | 33906 | 328 |
Numbers in the three rightmost columns are grid counts. Regions with high/low sea ice thickness correspond to areas with model offsets from the gridded observations outside of one standard deviation. (Standard deviations are provided in the observational product.)
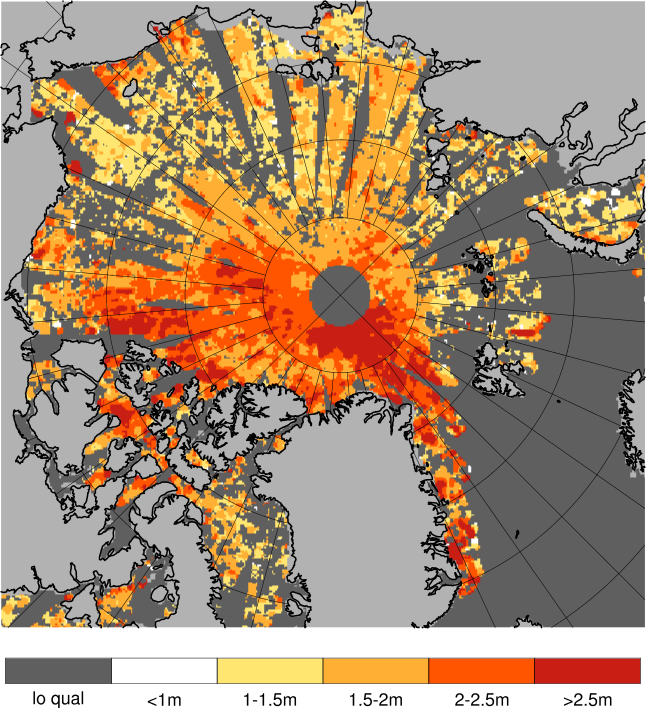
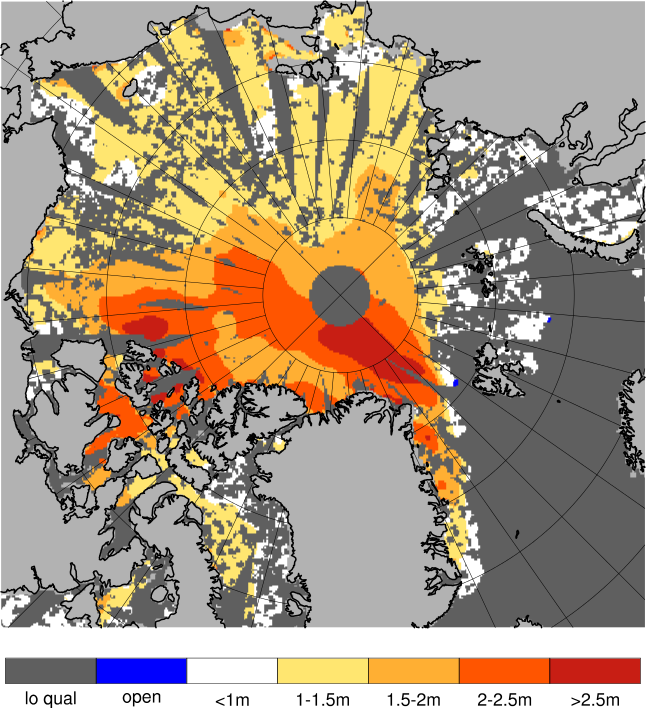
Definition of categories:
| Category | Sea ice thickness |
|---|---|
| c1 | <1m |
| c2 | 1 - 1.5m |
| c3 | 1.5 - 2m |
| c4 | 2 - 2.5m |
| c5 | 2.5 - 3m |
| c6 | >3m |
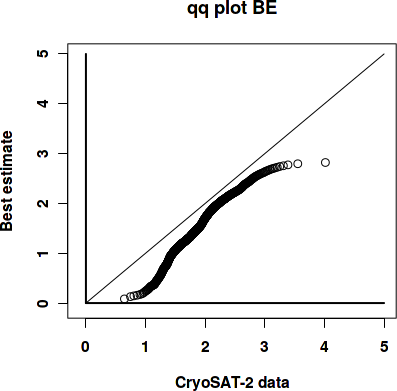
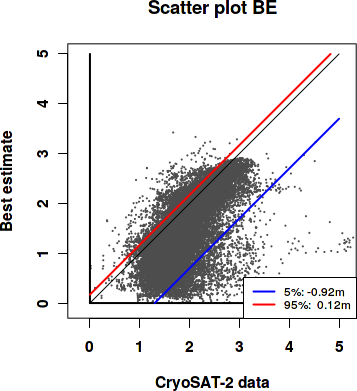
Best estimate vs. observations
Contingency table
| observations | |||||||||
|---|---|---|---|---|---|---|---|---|---|
| open | c1 | c2 | c3 | c4 | c5 | c6 | |||
| m o d e l |
open | 0 | 0 | 0 | 0 | 0 | 0 | 0 | |
| c1 | 0 | 0.007 | 0.091 | 0.075 | 0.019 | 0.005 | 0.005 | ||
| c2 | 0 | 0.003 | 0.131 | 0.198 | 0.033 | 0.005 | 0.002 | ||
| c3 | 0 | 0.001 | 0.008 | 0.116 | 0.083 | 0.007 | 0.001 | ||
| c4 | 0 | 0 | 0.002 | 0.023 | 0.1 | 0.039 | 0.005 | ||
| c5 | 0 | 0 | 0 | 0.002 | 0.007 | 0.025 | 0.007 | ||
| c6 | 0 | 0 | 0 | 0 | 0 | 0 | 0 | ||
See category definitions for details.
Statistical distribution
|
|
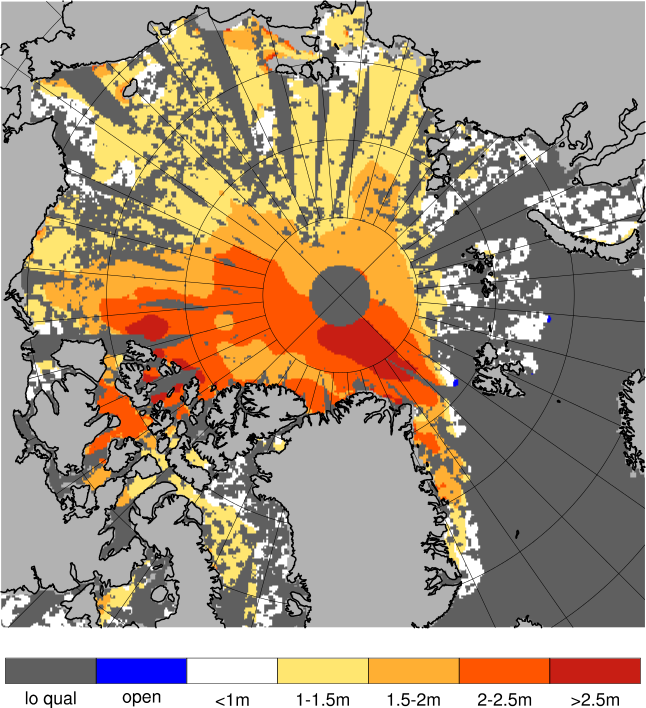
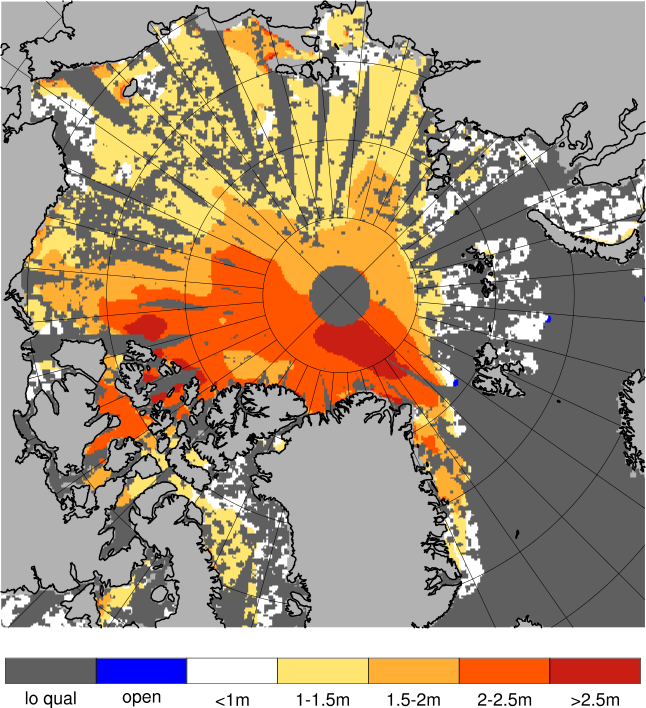
Observed sea ice thickness from CryoSAT
Sea ice thickness, best estimate product
Day 1 forecast vs. observations
Contingency table
| observations | |||||||||
|---|---|---|---|---|---|---|---|---|---|
| open | c1 | c2 | c3 | c4 | c5 | c6 | |||
| m o d e l |
open | 0 | 0 | 0 | 0 | 0 | 0 | 0 | |
| c1 | 0 | 0.007 | 0.087 | 0.076 | 0.02 | 0.005 | 0.005 | ||
| c2 | 0 | 0.003 | 0.131 | 0.187 | 0.032 | 0.005 | 0.002 | ||
| c3 | 0 | 0.001 | 0.011 | 0.123 | 0.077 | 0.008 | 0.001 | ||
| c4 | 0 | 0 | 0.003 | 0.027 | 0.106 | 0.04 | 0.006 | ||
| c5 | 0 | 0 | 0 | 0.002 | 0.007 | 0.023 | 0.006 | ||
| c6 | 0 | 0 | 0 | 0 | 0 | 0 | 0 | ||
See category definitions for details.
Statistical distribution
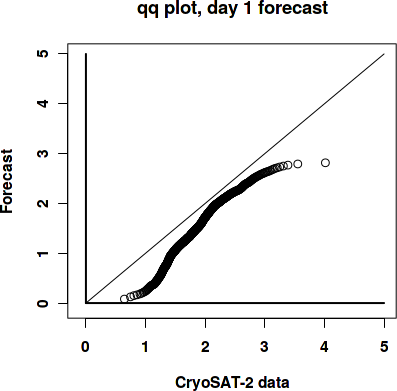
|
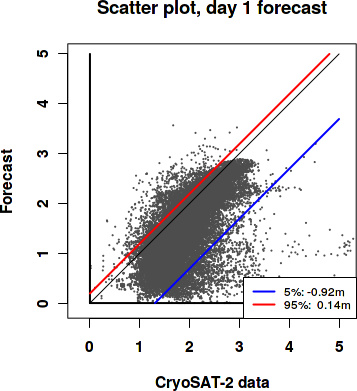
|
Sea ice thickness, day 1 forecast
Day 7 forecast vs. observations
Contingency table
| observations | |||||||||
|---|---|---|---|---|---|---|---|---|---|
| open | c1 | c2 | c3 | c4 | c5 | c6 | |||
| m o d e l |
open | 0 | 0 | 0 | 0 | 0 | 0 | 0 | |
| c1 | 0 | 0.007 | 0.082 | 0.074 | 0.02 | 0.005 | 0.005 | ||
| c2 | 0 | 0.003 | 0.131 | 0.177 | 0.03 | 0.004 | 0.002 | ||
| c3 | 0 | 0.001 | 0.015 | 0.126 | 0.071 | 0.008 | 0.001 | ||
| c4 | 0 | 0 | 0.003 | 0.034 | 0.115 | 0.04 | 0.005 | ||
| c5 | 0 | 0 | 0 | 0.002 | 0.006 | 0.022 | 0.006 | ||
| c6 | 0 | 0 | 0 | 0 | 0 | 0 | 0 | ||
See category definitions for details.
Statistical distribution
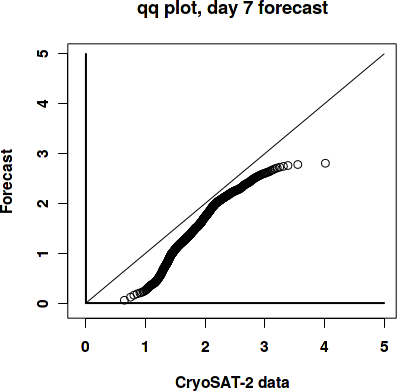
|

|
Sea ice thickness, day 7 forecast
Generated by /metno/routine/sms/V2/SIthickness/c2iceWebPage.sh Fri Mar 5 11:05:09 UTC 2021 on arcmfcval