Validation of ice thickness - Full domain
Bulletin date: 2021-01-28
Model: ARC MFC - TOPAZ
Data source: UCL CryoSAT-2 sea ice thickness
Validation statistics summary
| Bias (m) | RMS (m) | total grids | low SIT | OK SIT | high SIT | |
|---|---|---|---|---|---|---|
| Best estimate | -0.37 | 0.7 | 37633 | 5073 | 32460 | 100 |
| Day 1 forecast | -0.36 | 0.7 | 37633 | 5141 | 32394 | 98 |
| Day 4 forecast | -0.37 | 0.71 | 37633 | 5240 | 32289 | 104 |
| Day 7 forecast | -0.35 | 0.7 | 37633 | 5055 | 32473 | 105 |
| Day 10 forecast | -0.39 | 0.73 | 37633 | 5956 | 31586 | 91 |
Numbers in the three rightmost columns are grid counts. Regions with high/low sea ice thickness correspond to areas with model offsets from the gridded observations outside of one standard deviation. (Standard deviations are provided in the observational product.)
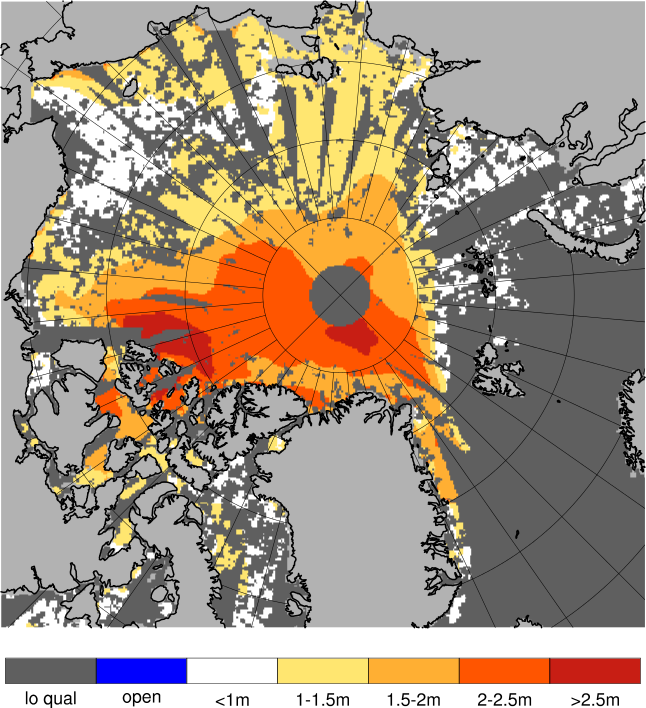
Definition of categories:
| Category | Sea ice thickness |
|---|---|
| c1 | <1m |
| c2 | 1 - 1.5m |
| c3 | 1.5 - 2m |
| c4 | 2 - 2.5m |
| c5 | 2.5 - 3m |
| c6 | >3m |
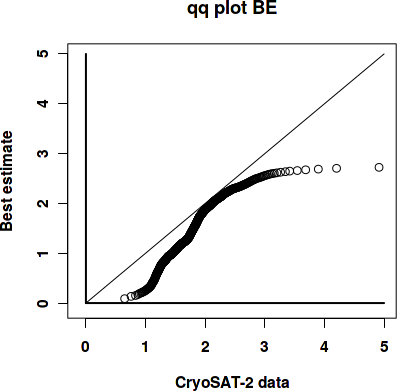
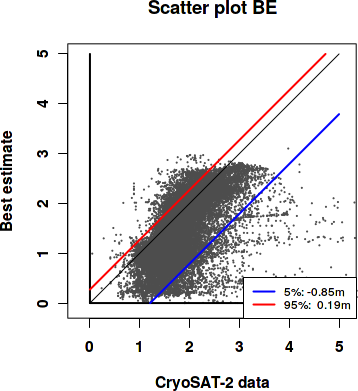
Best estimate vs. observations
Contingency table
| observations | |||||||||
|---|---|---|---|---|---|---|---|---|---|
| open | c1 | c2 | c3 | c4 | c5 | c6 | |||
| m o d e l |
open | 0 | 0 | 0 | 0 | 0 | 0 | 0 | |
| c1 | 0 | 0.013 | 0.135 | 0.083 | 0.015 | 0.003 | 0.006 | ||
| c2 | 0 | 0.002 | 0.138 | 0.15 | 0.02 | 0.004 | 0.003 | ||
| c3 | 0 | 0 | 0.011 | 0.132 | 0.057 | 0.007 | 0.004 | ||
| c4 | 0 | 0 | 0.001 | 0.047 | 0.1 | 0.031 | 0.005 | ||
| c5 | 0 | 0 | 0 | 0.002 | 0.011 | 0.013 | 0.006 | ||
| c6 | 0 | 0 | 0 | 0 | 0 | 0 | 0 | ||
See category definitions for details.
Statistical distribution
|
|
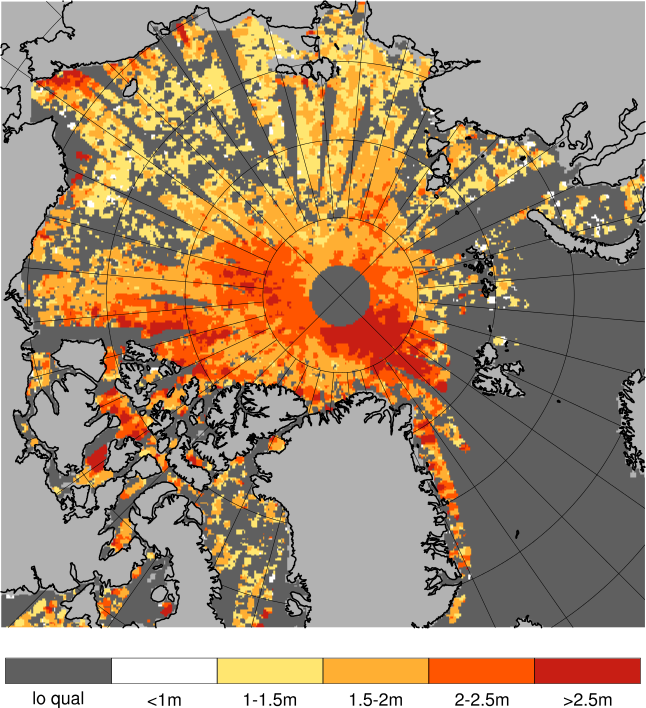
Observed sea ice thickness from CryoSAT
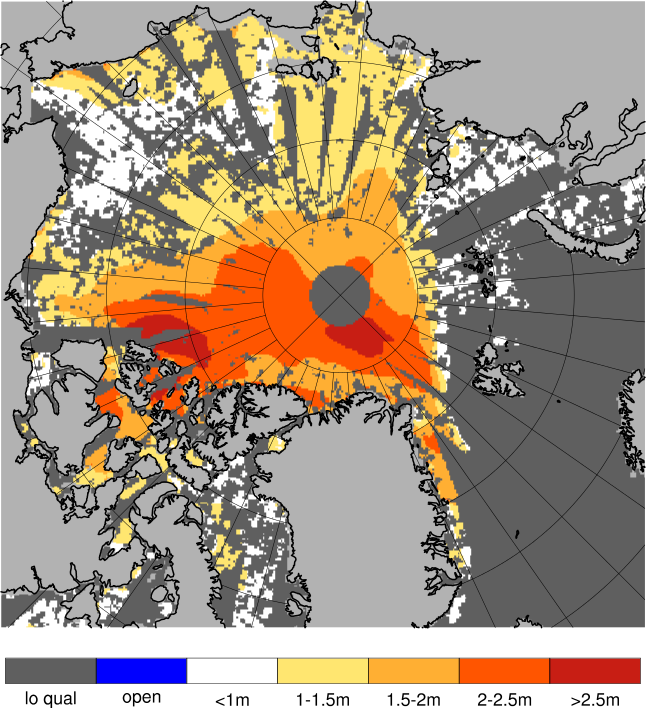
Sea ice thickness, best estimate product
Day 1 forecast vs. observations
Contingency table
| observations | |||||||||
|---|---|---|---|---|---|---|---|---|---|
| open | c1 | c2 | c3 | c4 | c5 | c6 | |||
| m o d e l |
open | 0 | 0 | 0 | 0 | 0 | 0 | 0 | |
| c1 | 0 | 0.012 | 0.126 | 0.083 | 0.015 | 0.003 | 0.005 | ||
| c2 | 0 | 0.003 | 0.145 | 0.15 | 0.021 | 0.005 | 0.003 | ||
| c3 | 0 | 0 | 0.012 | 0.128 | 0.057 | 0.008 | 0.005 | ||
| c4 | 0 | 0 | 0.002 | 0.05 | 0.098 | 0.031 | 0.006 | ||
| c5 | 0 | 0 | 0 | 0.003 | 0.013 | 0.012 | 0.004 | ||
| c6 | 0 | 0 | 0 | 0 | 0 | 0 | 0 | ||
See category definitions for details.
Statistical distribution
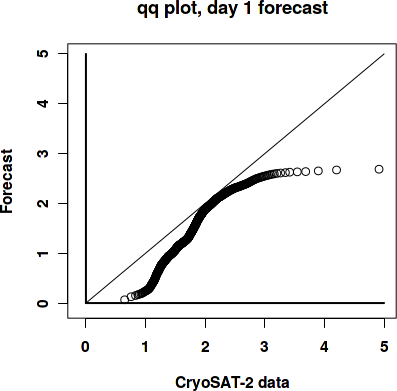
|
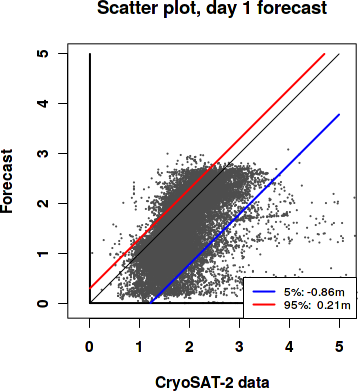
|
Sea ice thickness, day 1 forecast
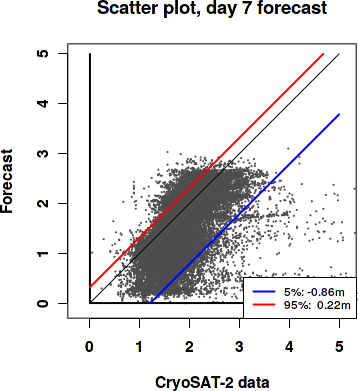
Day 7 forecast vs. observations
Contingency table
| observations | |||||||||
|---|---|---|---|---|---|---|---|---|---|
| open | c1 | c2 | c3 | c4 | c5 | c6 | |||
| m o d e l |
open | 0 | 0 | 0 | 0 | 0 | 0 | 0 | |
| c1 | 0 | 0.012 | 0.113 | 0.079 | 0.014 | 0.003 | 0.006 | ||
| c2 | 0 | 0.004 | 0.158 | 0.15 | 0.023 | 0.005 | 0.002 | ||
| c3 | 0 | 0 | 0.012 | 0.124 | 0.053 | 0.009 | 0.005 | ||
| c4 | 0 | 0 | 0.002 | 0.057 | 0.1 | 0.03 | 0.007 | ||
| c5 | 0 | 0 | 0 | 0.003 | 0.014 | 0.012 | 0.003 | ||
| c6 | 0 | 0 | 0 | 0 | 0 | 0 | 0 | ||
See category definitions for details.
Statistical distribution
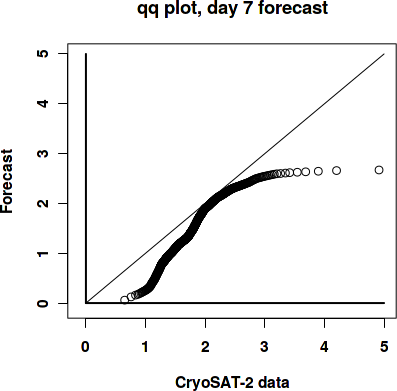
|
|
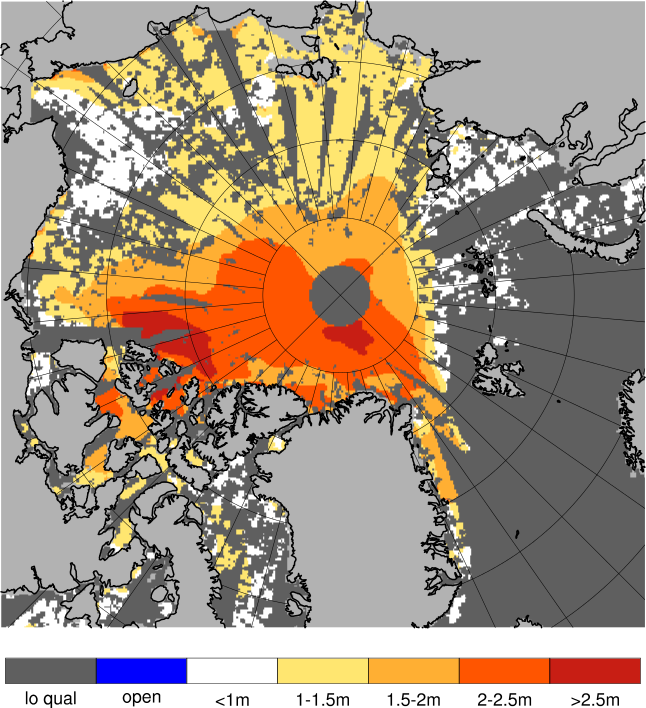
Sea ice thickness, day 7 forecast
Generated by /metno/routine/sms/V2/SIthickness/c2iceWebPage.sh Fri Feb 12 01:09:59 UTC 2021 on arcmfcval