Validation of ice thickness - Full domain
Bulletin date: 2020-12-31
Model: ARC MFC - TOPAZ
Data source: UCL CryoSAT-2 sea ice thickness
Validation statistics summary
| Bias (m) | RMS (m) | total grids | low SIT | OK SIT | high SIT | |
|---|---|---|---|---|---|---|
| Best estimate | -0.29 | 0.69 | 31365 | 4726 | 26476 | 163 |
| Day 1 forecast | -0.29 | 0.7 | 31365 | 4817 | 26377 | 171 |
| Day 4 forecast | -0.29 | 0.7 | 31365 | 4996 | 26197 | 172 |
| Day 7 forecast | -0.27 | 0.69 | 31365 | 4595 | 26587 | 183 |
| Day 10 forecast | -0.3 | 0.72 | 31365 | 5339 | 25832 | 194 |
Numbers in the three rightmost columns are grid counts. Regions with high/low sea ice thickness correspond to areas with model offsets from the gridded observations outside of one standard deviation. (Standard deviations are provided in the observational product.)
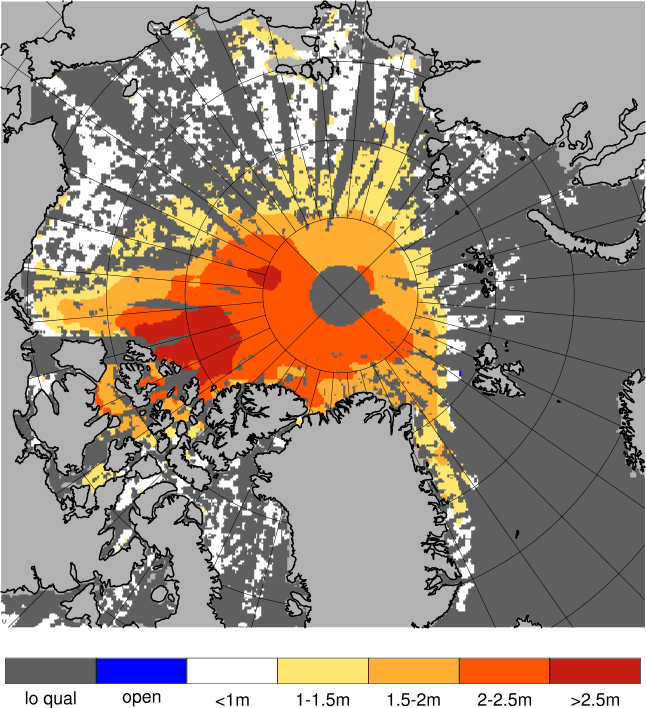
Definition of categories:
| Category | Sea ice thickness |
|---|---|
| c1 | <1m |
| c2 | 1 - 1.5m |
| c3 | 1.5 - 2m |
| c4 | 2 - 2.5m |
| c5 | 2.5 - 3m |
| c6 | >3m |
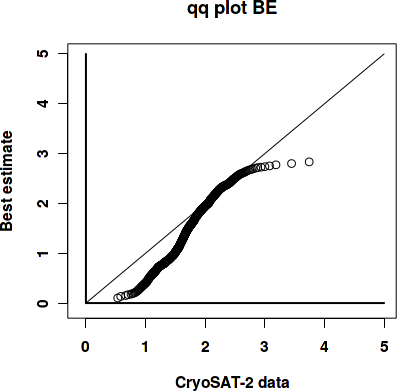
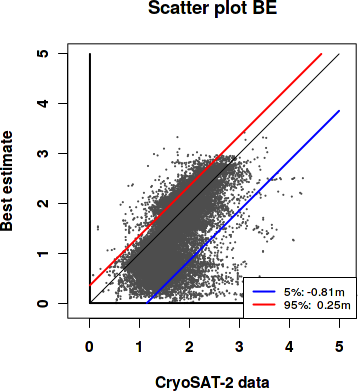
Best estimate vs. observations
Contingency table
| observations | |||||||||
|---|---|---|---|---|---|---|---|---|---|
| open | c1 | c2 | c3 | c4 | c5 | c6 | |||
| m o d e l |
open | 0 | 0 | 0 | 0 | 0 | 0 | 0 | |
| c1 | 0 | 0.038 | 0.227 | 0.077 | 0.017 | 0.003 | 0.005 | ||
| c2 | 0 | 0.003 | 0.083 | 0.067 | 0.009 | 0.001 | 0.001 | ||
| c3 | 0 | 0.001 | 0.02 | 0.145 | 0.052 | 0.004 | 0.001 | ||
| c4 | 0 | 0 | 0.003 | 0.058 | 0.123 | 0.01 | 0.002 | ||
| c5 | 0 | 0 | 0 | 0.002 | 0.027 | 0.021 | 0.002 | ||
| c6 | 0 | 0 | 0 | 0 | 0 | 0 | 0 | ||
See category definitions for details.
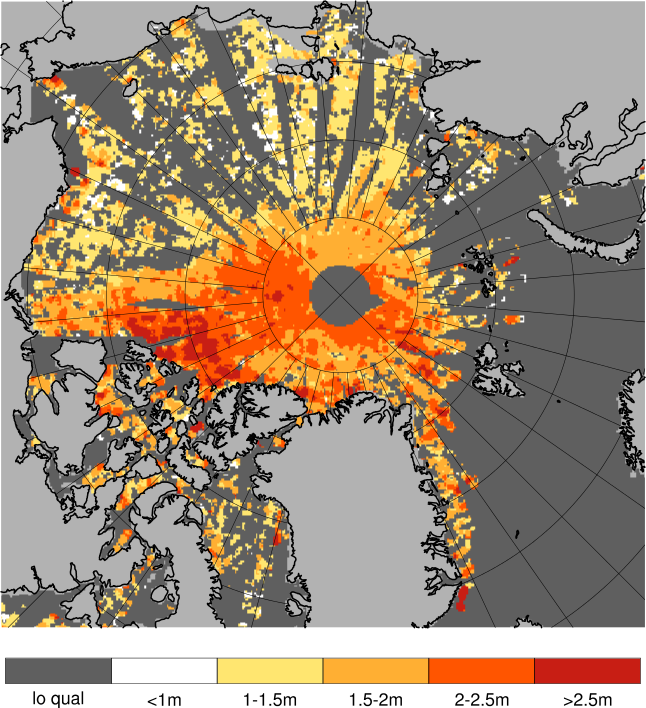
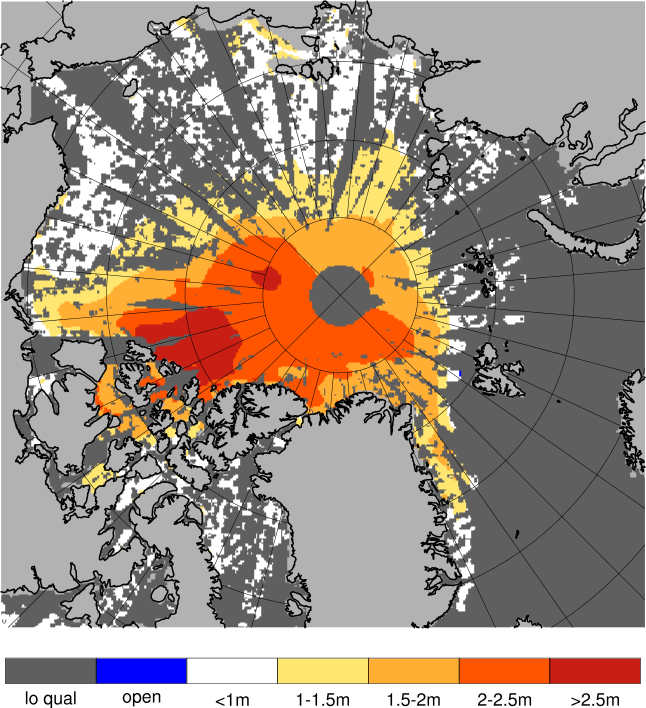
Statistical distribution
|
|
Observed sea ice thickness from CryoSAT
Sea ice thickness, best estimate product

Day 1 forecast vs. observations
Contingency table
| observations | |||||||||
|---|---|---|---|---|---|---|---|---|---|
| open | c1 | c2 | c3 | c4 | c5 | c6 | |||
| m o d e l |
open | 0 | 0 | 0 | 0 | 0 | 0 | 0 | |
| c1 | 0 | 0.038 | 0.22 | 0.077 | 0.017 | 0.004 | 0.005 | ||
| c2 | 0 | 0.004 | 0.088 | 0.069 | 0.012 | 0.001 | 0.001 | ||
| c3 | 0 | 0.001 | 0.019 | 0.135 | 0.046 | 0.004 | 0.001 | ||
| c4 | 0 | 0 | 0.004 | 0.065 | 0.122 | 0.01 | 0.002 | ||
| c5 | 0 | 0 | 0 | 0.002 | 0.03 | 0.021 | 0.002 | ||
| c6 | 0 | 0 | 0 | 0 | 0 | 0 | 0 | ||
See category definitions for details.
Statistical distribution

|

|
Sea ice thickness, day 1 forecast
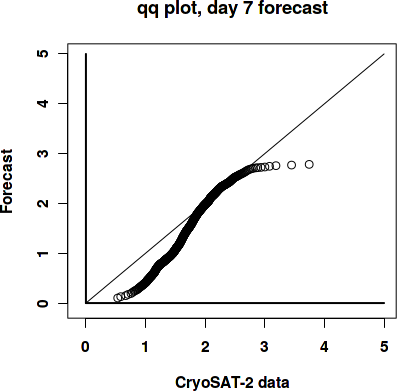
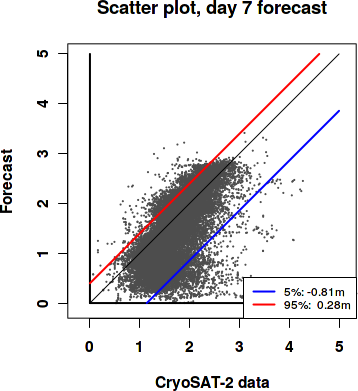
Day 7 forecast vs. observations
Contingency table
| observations | |||||||||
|---|---|---|---|---|---|---|---|---|---|
| open | c1 | c2 | c3 | c4 | c5 | c6 | |||
| m o d e l |
open | 0 | 0 | 0 | 0 | 0 | 0 | 0 | |
| c1 | 0 | 0.036 | 0.206 | 0.076 | 0.017 | 0.003 | 0.005 | ||
| c2 | 0 | 0.006 | 0.1 | 0.069 | 0.014 | 0.001 | 0.001 | ||
| c3 | 0 | 0.001 | 0.022 | 0.13 | 0.043 | 0.004 | 0.001 | ||
| c4 | 0 | 0 | 0.004 | 0.072 | 0.123 | 0.01 | 0.002 | ||
| c5 | 0 | 0 | 0 | 0.002 | 0.031 | 0.021 | 0.001 | ||
| c6 | 0 | 0 | 0 | 0 | 0 | 0 | 0 | ||
See category definitions for details.
Statistical distribution
|
|
Sea ice thickness, day 7 forecast
Generated by /metno/routine/sms/V2/SIthickness/c2iceWebPage.sh Fri Jan 15 01:11:09 UTC 2021 on arcmfcval