Validation of ice thickness - Full domain
Bulletin date: 2020-12-10
Model: ARC MFC - TOPAZ
Data source: UCL CryoSAT-2 sea ice thickness
Validation statistics summary
| Bias (m) | RMS (m) | total grids | low SIT | OK SIT | high SIT | |
|---|---|---|---|---|---|---|
| Best estimate | -0.41 | 0.74 | 29762 | 6113 | 23574 | 75 |
| Day 1 forecast | -0.44 | 0.76 | 29762 | 6365 | 23323 | 74 |
| Day 4 forecast | -0.45 | 0.77 | 29762 | 6605 | 23082 | 75 |
| Day 7 forecast | -0.44 | 0.75 | 29762 | 6194 | 23492 | 76 |
| Day 10 forecast | -0.51 | 0.8 | 29762 | 7249 | 22440 | 73 |
Numbers in the three rightmost columns are grid counts. Regions with high/low sea ice thickness correspond to areas with model offsets from the gridded observations outside of one standard deviation. (Standard deviations are provided in the observational product.)
Definition of categories:
| Category | Sea ice thickness |
|---|---|
| c1 | <1m |
| c2 | 1 - 1.5m |
| c3 | 1.5 - 2m |
| c4 | 2 - 2.5m |
| c5 | 2.5 - 3m |
| c6 | >3m |
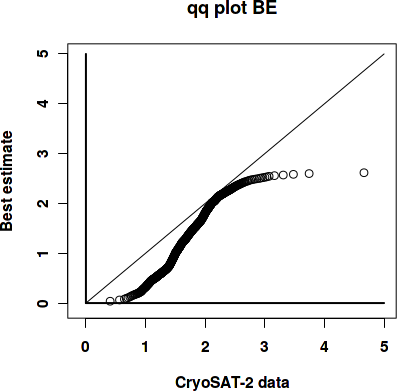
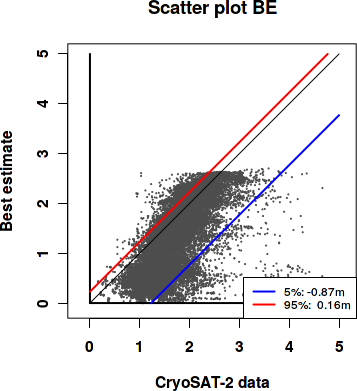
Best estimate vs. observations
Contingency table
| observations | |||||||||
|---|---|---|---|---|---|---|---|---|---|
| open | c1 | c2 | c3 | c4 | c5 | c6 | |||
| m o d e l |
open | 0 | 0 | 0.001 | 0 | 0 | 0 | 0 | |
| c1 | 0 | 0.052 | 0.218 | 0.074 | 0.015 | 0.002 | 0.004 | ||
| c2 | 0 | 0.002 | 0.079 | 0.1 | 0.014 | 0.003 | 0.001 | ||
| c3 | 0 | 0 | 0.01 | 0.108 | 0.069 | 0.005 | 0.001 | ||
| c4 | 0 | 0 | 0.002 | 0.037 | 0.15 | 0.025 | 0.006 | ||
| c5 | 0 | 0 | 0 | 0 | 0.006 | 0.01 | 0.002 | ||
| c6 | 0 | 0 | 0 | 0 | 0 | 0 | 0 | ||
See category definitions for details.
Statistical distribution
|
|
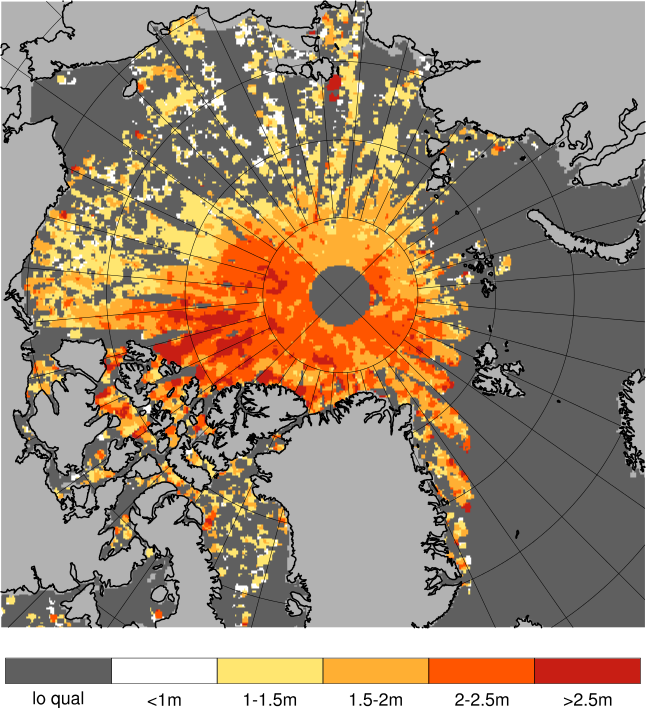
Observed sea ice thickness from CryoSAT
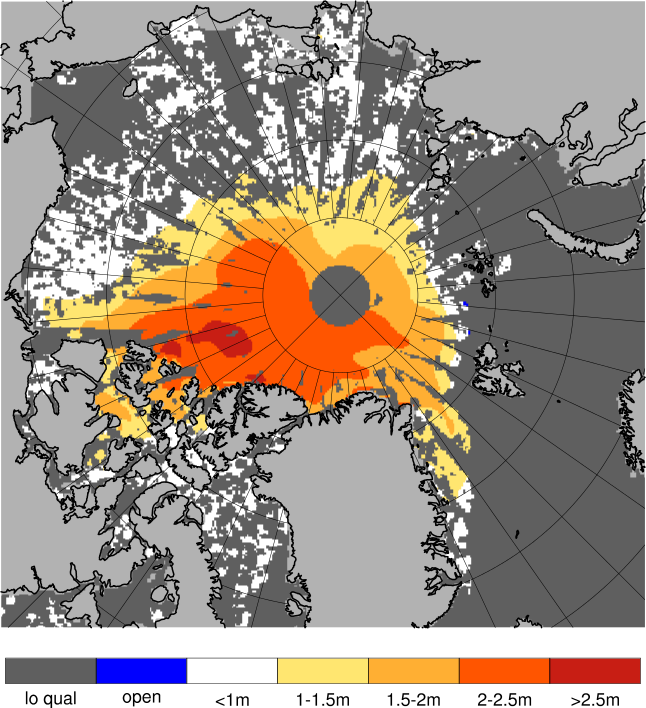
Sea ice thickness, best estimate product
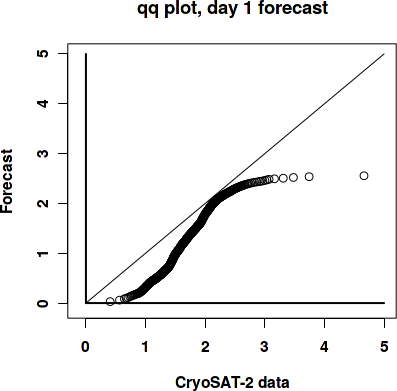
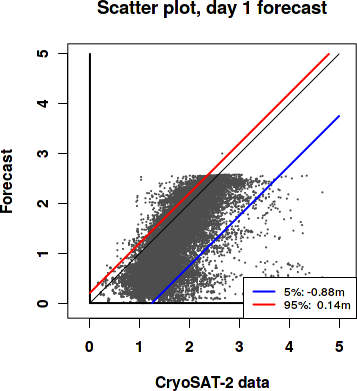
Day 1 forecast vs. observations
Contingency table
| observations | |||||||||
|---|---|---|---|---|---|---|---|---|---|
| open | c1 | c2 | c3 | c4 | c5 | c6 | |||
| m o d e l |
open | 0 | 0 | 0.001 | 0 | 0 | 0 | 0 | |
| c1 | 0 | 0.052 | 0.223 | 0.075 | 0.015 | 0.002 | 0.004 | ||
| c2 | 0 | 0.002 | 0.074 | 0.114 | 0.018 | 0.004 | 0.001 | ||
| c3 | 0 | 0 | 0.01 | 0.097 | 0.076 | 0.006 | 0.001 | ||
| c4 | 0 | 0 | 0.002 | 0.034 | 0.143 | 0.03 | 0.007 | ||
| c5 | 0 | 0 | 0 | 0 | 0.003 | 0.004 | 0.001 | ||
| c6 | 0 | 0 | 0 | 0 | 0 | 0 | 0 | ||
See category definitions for details.
Statistical distribution
|
|
Sea ice thickness, day 1 forecast

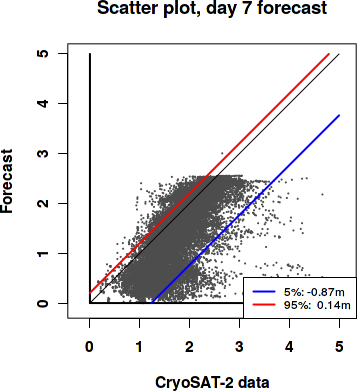
Day 7 forecast vs. observations
Contingency table
| observations | |||||||||
|---|---|---|---|---|---|---|---|---|---|
| open | c1 | c2 | c3 | c4 | c5 | c6 | |||
| m o d e l |
open | 0 | 0 | 0.001 | 0 | 0 | 0 | 0 | |
| c1 | 0 | 0.052 | 0.221 | 0.076 | 0.015 | 0.002 | 0.004 | ||
| c2 | 0 | 0.002 | 0.075 | 0.114 | 0.019 | 0.004 | 0.001 | ||
| c3 | 0 | 0 | 0.011 | 0.096 | 0.076 | 0.006 | 0.002 | ||
| c4 | 0 | 0 | 0.002 | 0.034 | 0.143 | 0.032 | 0.007 | ||
| c5 | 0 | 0 | 0 | 0 | 0.002 | 0.002 | 0 | ||
| c6 | 0 | 0 | 0 | 0 | 0 | 0 | 0 | ||
See category definitions for details.
Statistical distribution

|
|
Sea ice thickness, day 7 forecast
Generated by /metno/routine/sms/V2/SIthickness/c2iceWebPage.sh Fri Dec 25 01:11:13 UTC 2020 on arcmfcval