Validation of ice thickness - Full domain
Bulletin date: 2020-11-26
Model: ARC MFC - TOPAZ
Data source: UCL CryoSAT-2 sea ice thickness
Validation statistics summary
| Bias (m) | RMS (m) | total grids | low SIT | OK SIT | high SIT | |
|---|---|---|---|---|---|---|
| Best estimate | -0.42 | 0.66 | 26130 | 6374 | 19683 | 73 |
| Day 1 forecast | -0.45 | 0.68 | 26130 | 6638 | 19426 | 66 |
| Day 4 forecast | -0.46 | 0.69 | 26130 | 6842 | 19226 | 62 |
| Day 7 forecast | -0.45 | 0.67 | 26130 | 6513 | 19542 | 75 |
| Day 10 forecast | -0.51 | 0.72 | 26130 | 7685 | 18394 | 51 |
Numbers in the three rightmost columns are grid counts. Regions with high/low sea ice thickness correspond to areas with model offsets from the gridded observations outside of one standard deviation. (Standard deviations are provided in the observational product.)
Definition of categories:
| Category | Sea ice thickness |
|---|---|
| c1 | <1m |
| c2 | 1 - 1.5m |
| c3 | 1.5 - 2m |
| c4 | 2 - 2.5m |
| c5 | 2.5 - 3m |
| c6 | >3m |
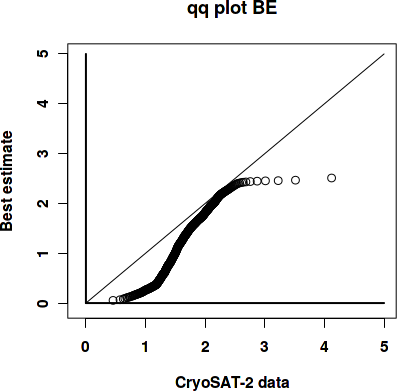
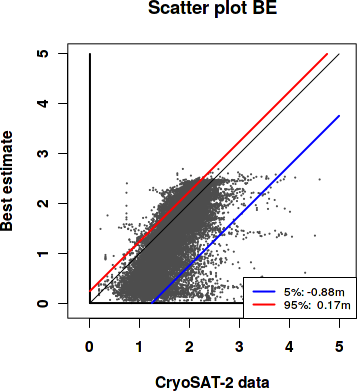
Best estimate vs. observations
Contingency table
| observations | |||||||||
|---|---|---|---|---|---|---|---|---|---|
| open | c1 | c2 | c3 | c4 | c5 | c6 | |||
| m o d e l |
open | 0 | 0 | 0 | 0 | 0 | 0 | 0 | |
| c1 | 0 | 0.075 | 0.227 | 0.074 | 0.013 | 0.002 | 0.003 | ||
| c2 | 0 | 0.002 | 0.078 | 0.091 | 0.012 | 0.002 | 0.001 | ||
| c3 | 0 | 0.001 | 0.013 | 0.149 | 0.099 | 0.004 | 0 | ||
| c4 | 0 | 0 | 0.001 | 0.037 | 0.103 | 0.011 | 0.001 | ||
| c5 | 0 | 0 | 0 | 0 | 0 | 0 | 0.001 | ||
| c6 | 0 | 0 | 0 | 0 | 0 | 0 | 0 | ||
See category definitions for details.
Statistical distribution
|
|
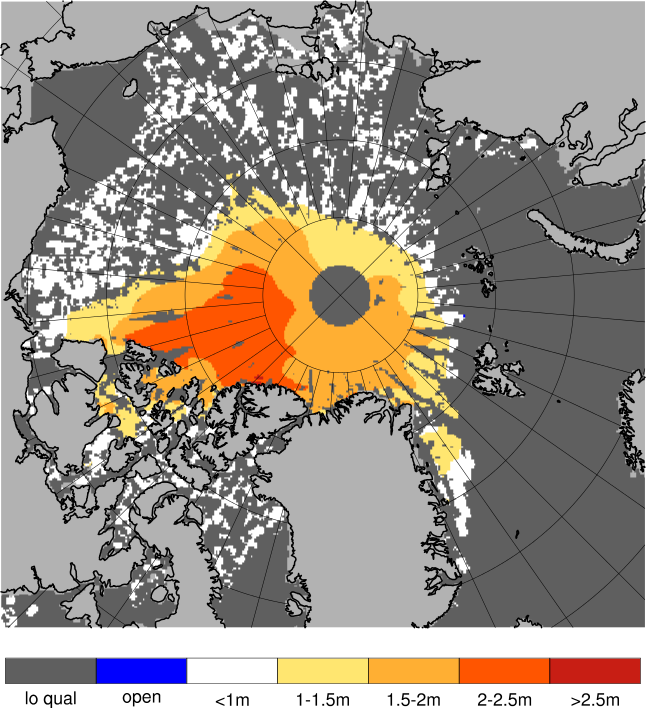
Observed sea ice thickness from CryoSAT
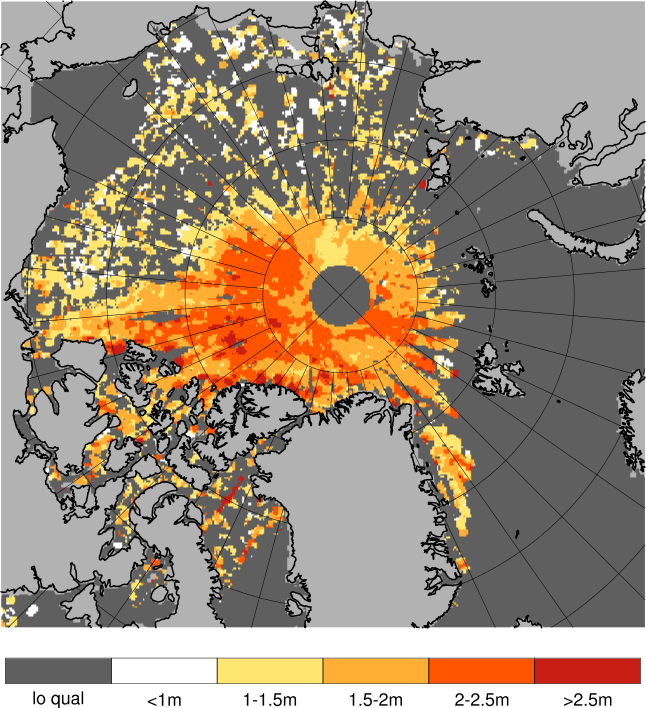
Sea ice thickness, best estimate product

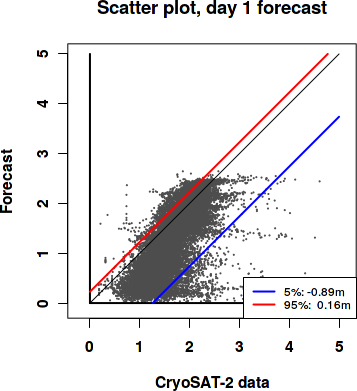
Day 1 forecast vs. observations
Contingency table
| observations | |||||||||
|---|---|---|---|---|---|---|---|---|---|
| open | c1 | c2 | c3 | c4 | c5 | c6 | |||
| m o d e l |
open | 0 | 0 | 0 | 0 | 0 | 0 | 0 | |
| c1 | 0 | 0.075 | 0.234 | 0.078 | 0.013 | 0.002 | 0.003 | ||
| c2 | 0 | 0.002 | 0.072 | 0.099 | 0.016 | 0.002 | 0.001 | ||
| c3 | 0 | 0.001 | 0.012 | 0.142 | 0.104 | 0.004 | 0.001 | ||
| c4 | 0 | 0 | 0.001 | 0.032 | 0.093 | 0.011 | 0.002 | ||
| c5 | 0 | 0 | 0 | 0 | 0 | 0 | 0.001 | ||
| c6 | 0 | 0 | 0 | 0 | 0 | 0 | 0 | ||
See category definitions for details.
Statistical distribution

|
|
Sea ice thickness, day 1 forecast
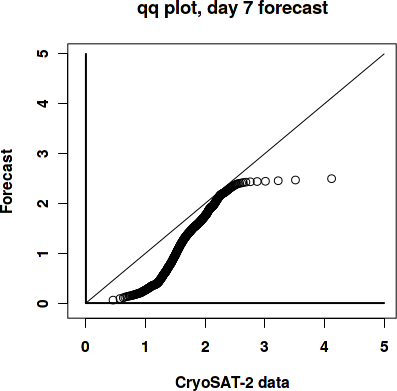
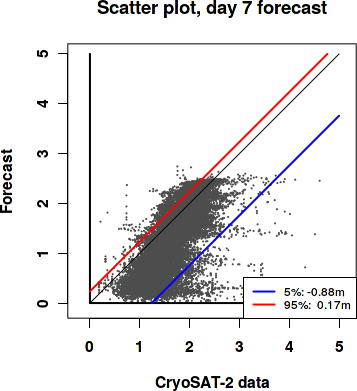
Day 7 forecast vs. observations
Contingency table
| observations | |||||||||
|---|---|---|---|---|---|---|---|---|---|
| open | c1 | c2 | c3 | c4 | c5 | c6 | |||
| m o d e l |
open | 0 | 0 | 0 | 0 | 0 | 0 | 0 | |
| c1 | 0 | 0.075 | 0.235 | 0.077 | 0.014 | 0.002 | 0.003 | ||
| c2 | 0 | 0.002 | 0.07 | 0.106 | 0.017 | 0.002 | 0.001 | ||
| c3 | 0 | 0.001 | 0.012 | 0.135 | 0.103 | 0.004 | 0.001 | ||
| c4 | 0 | 0 | 0.001 | 0.032 | 0.092 | 0.011 | 0.002 | ||
| c5 | 0 | 0 | 0 | 0 | 0 | 0 | 0 | ||
| c6 | 0 | 0 | 0 | 0 | 0 | 0 | 0 | ||
See category definitions for details.
Statistical distribution
|
|
Sea ice thickness, day 7 forecast

Generated by /metno/routine/sms/V2/SIthickness/c2iceWebPage.sh Fri Dec 11 01:11:07 UTC 2020 on arcmfcval