Validation of ice thickness - Full domain
Bulletin date: 2020-11-12
Model: ARC MFC - TOPAZ
Data source: UCL CryoSAT-2 sea ice thickness
Validation statistics summary
| Bias (m) | RMS (m) | total grids | low SIT | OK SIT | high SIT | |
|---|---|---|---|---|---|---|
| Best estimate | -0.47 | 0.85 | 21378 | 5242 | 16094 | 42 |
| Day 1 forecast | -0.56 | 0.89 | 21378 | 5721 | 15621 | 36 |
| Day 4 forecast | -0.6 | 0.91 | 21378 | 6119 | 15222 | 37 |
| Day 7 forecast | -0.59 | 0.9 | 21378 | 5864 | 15476 | 38 |
| Day 10 forecast | -0.83 | 1.07 | 21378 | 11277 | 10046 | 55 |
Numbers in the three rightmost columns are grid counts. Regions with high/low sea ice thickness correspond to areas with model offsets from the gridded observations outside of one standard deviation. (Standard deviations are provided in the observational product.)
Definition of categories:
| Category | Sea ice thickness |
|---|---|
| c1 | <1m |
| c2 | 1 - 1.5m |
| c3 | 1.5 - 2m |
| c4 | 2 - 2.5m |
| c5 | 2.5 - 3m |
| c6 | >3m |
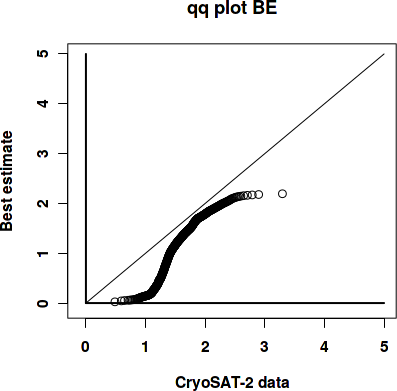
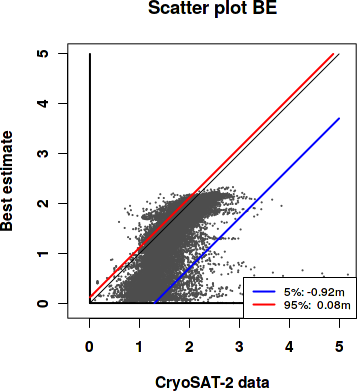
Best estimate vs. observations
Contingency table
| observations | |||||||||
|---|---|---|---|---|---|---|---|---|---|
| open | c1 | c2 | c3 | c4 | c5 | c6 | |||
| m o d e l |
open | 0 | 0 | 0 | 0 | 0 | 0.001 | 0 | |
| c1 | 0 | 0.065 | 0.224 | 0.064 | 0.013 | 0.002 | 0.004 | ||
| c2 | 0 | 0.001 | 0.141 | 0.137 | 0.009 | 0.001 | 0 | ||
| c3 | 0 | 0.001 | 0.019 | 0.173 | 0.08 | 0.004 | 0.001 | ||
| c4 | 0 | 0 | 0 | 0.006 | 0.041 | 0.012 | 0.001 | ||
| c5 | 0 | 0 | 0 | 0 | 0 | 0 | 0 | ||
| c6 | 0 | 0 | 0 | 0 | 0 | 0 | 0 | ||
See category definitions for details.
Statistical distribution
|
|
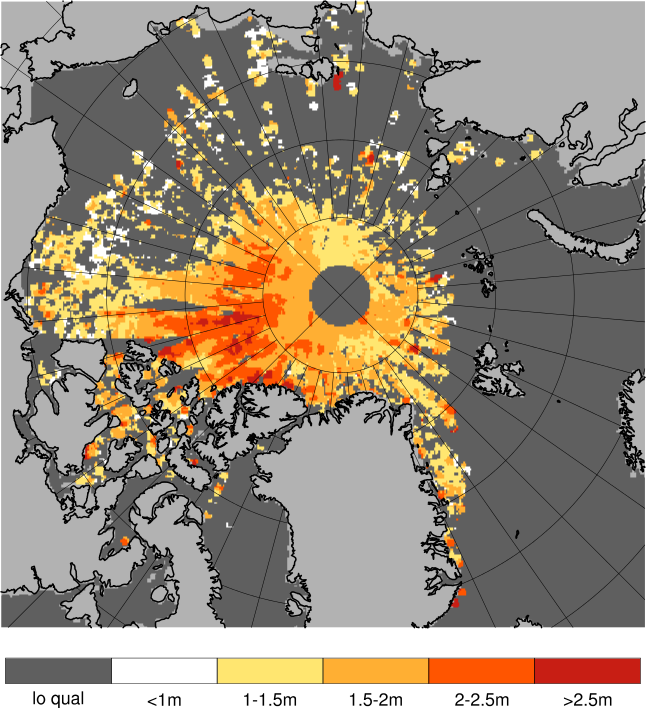
Observed sea ice thickness from CryoSAT
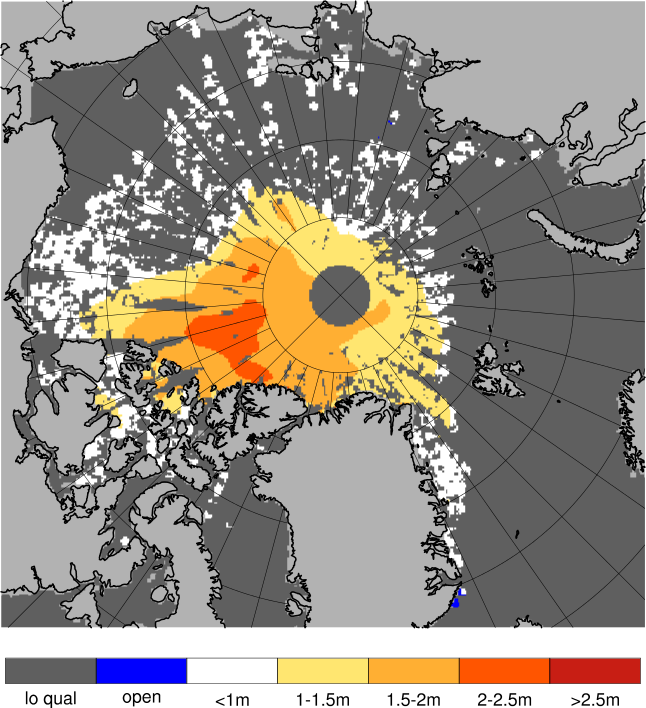
Sea ice thickness, best estimate product
Day 1 forecast vs. observations
Contingency table
| observations | |||||||||
|---|---|---|---|---|---|---|---|---|---|
| open | c1 | c2 | c3 | c4 | c5 | c6 | |||
| m o d e l |
open | 0 | 0 | 0 | 0 | 0.001 | 0.001 | 0 | |
| c1 | 0 | 0.064 | 0.254 | 0.079 | 0.014 | 0.002 | 0.004 | ||
| c2 | 0 | 0.001 | 0.116 | 0.181 | 0.014 | 0.001 | 0 | ||
| c3 | 0 | 0.001 | 0.014 | 0.12 | 0.111 | 0.015 | 0.001 | ||
| c4 | 0 | 0 | 0 | 0.001 | 0.003 | 0.001 | 0 | ||
| c5 | 0 | 0 | 0 | 0 | 0 | 0 | 0 | ||
| c6 | 0 | 0 | 0 | 0 | 0 | 0 | 0 | ||
See category definitions for details.
Statistical distribution
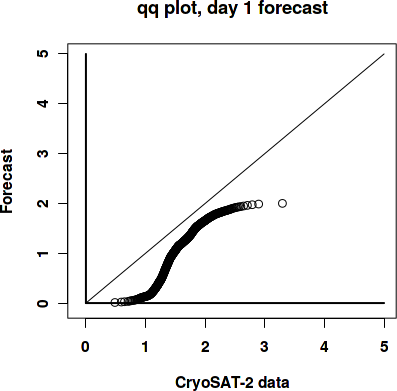
|
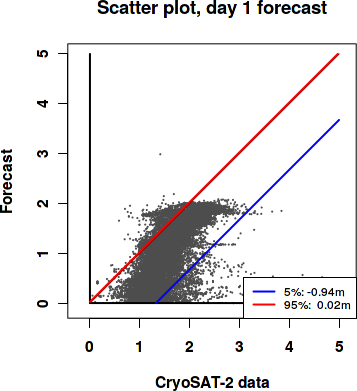
|
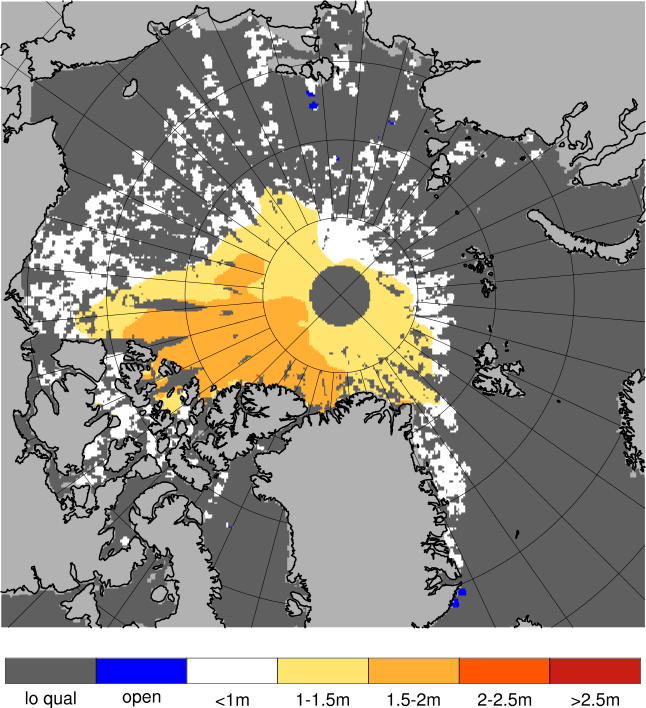
Sea ice thickness, day 1 forecast

Day 7 forecast vs. observations
Contingency table
| observations | |||||||||
|---|---|---|---|---|---|---|---|---|---|
| open | c1 | c2 | c3 | c4 | c5 | c6 | |||
| m o d e l |
open | 0 | 0.001 | 0.001 | 0 | 0.001 | 0.001 | 0 | |
| c1 | 0 | 0.063 | 0.264 | 0.088 | 0.015 | 0.002 | 0.004 | ||
| c2 | 0 | 0.002 | 0.106 | 0.192 | 0.024 | 0.001 | 0 | ||
| c3 | 0 | 0.001 | 0.015 | 0.1 | 0.103 | 0.016 | 0.001 | ||
| c4 | 0 | 0 | 0 | 0 | 0 | 0 | 0 | ||
| c5 | 0 | 0 | 0 | 0 | 0 | 0 | 0 | ||
| c6 | 0 | 0 | 0 | 0 | 0 | 0 | 0 | ||
See category definitions for details.
Statistical distribution

|
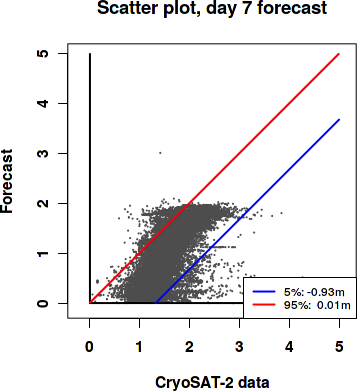
|
Sea ice thickness, day 7 forecast
Generated by /metno/routine/sms/V2/SIthickness/c2iceWebPage.sh Fri Nov 27 01:10:45 UTC 2020 on arcmfcval