Validation of ice thickness - Full domain
Bulletin date: 2020-03-12
Model: ARC MFC - TOPAZ
Data source: UCL CryoSAT-2 sea ice thickness
Validation statistics summary
| Bias (m) | RMS (m) | total grids | low SIT | OK SIT | high SIT | |
|---|---|---|---|---|---|---|
| Best estimate | -0.79 | 1.05 | 41916 | 16321 | 25503 | 92 |
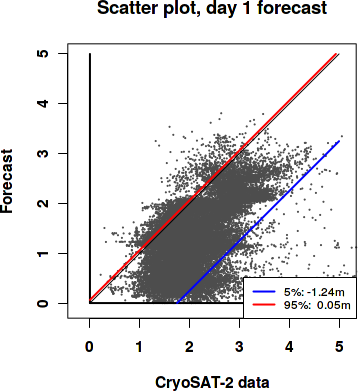
| Day 1 forecast | -0.79 | 1.04 | 41916 | 16206 | 25621 | 89 |
| Day 4 forecast | -0.8 | 1.05 | 41916 | 16329 | 25500 | 87 |
| Day 7 forecast | -0.78 | 1.03 | 41916 | 15739 | 26087 | 90 |
| Day 10 forecast | -0.79 | 1.04 | 41916 | 16260 | 25563 | 93 |
Numbers in the three rightmost columns are grid counts. Regions with high/low sea ice thickness correspond to areas with model offsets from the gridded observations outside of one standard deviation. (Standard deviations are provided in the observational product.)
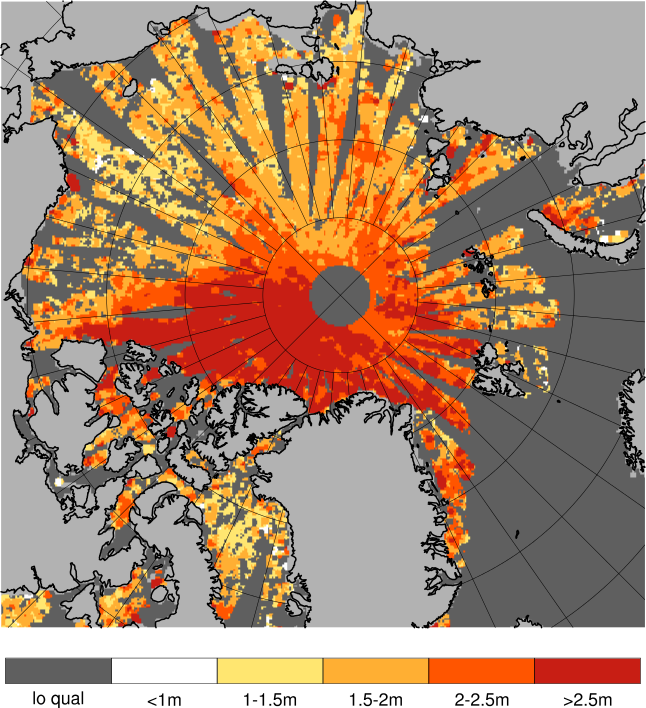
Definition of categories:
| Category | Sea ice thickness |
|---|---|
| c1 | <1m |
| c2 | 1 - 1.5m |
| c3 | 1.5 - 2m |
| c4 | 2 - 2.5m |
| c5 | 2.5 - 3m |
| c6 | >3m |
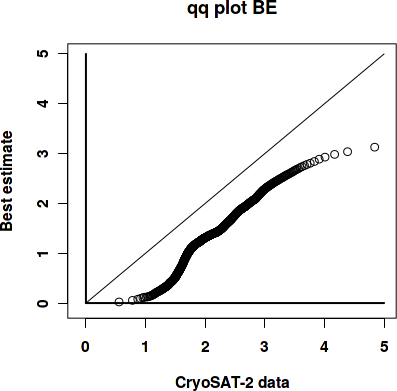
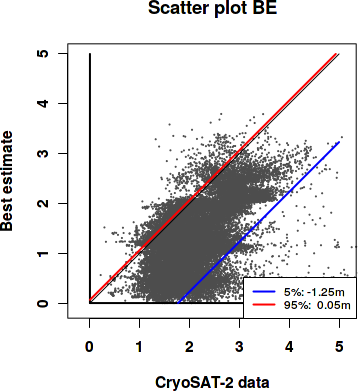
Best estimate vs. observations
Contingency table
| observations | |||||||||
|---|---|---|---|---|---|---|---|---|---|
| open | c1 | c2 | c3 | c4 | c5 | c6 | |||
| m o d e l |
open | 0 | 0 | 0 | 0 | 0 | 0 | 0 | |
| c1 | 0 | 0.005 | 0.069 | 0.156 | 0.063 | 0.014 | 0.007 | ||
| c2 | 0 | 0.002 | 0.066 | 0.194 | 0.098 | 0.025 | 0.006 | ||
| c3 | 0 | 0 | 0.009 | 0.042 | 0.053 | 0.044 | 0.005 | ||
| c4 | 0 | 0 | 0 | 0.005 | 0.015 | 0.045 | 0.037 | ||
| c5 | 0 | 0 | 0 | 0.001 | 0.005 | 0.011 | 0.017 | ||
| c6 | 0 | 0 | 0 | 0 | 0.001 | 0.002 | 0.002 | ||
See category definitions for details.
Statistical distribution
|
|
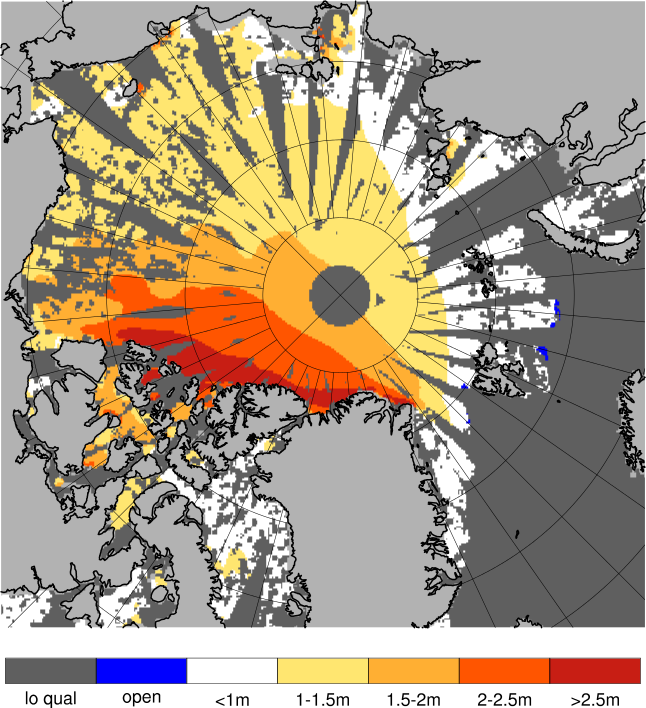
Observed sea ice thickness from CryoSAT
Sea ice thickness, best estimate product

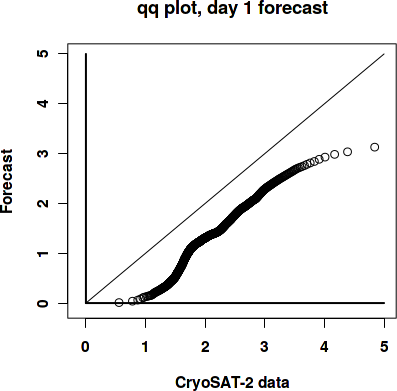
Day 1 forecast vs. observations
Contingency table
| observations | |||||||||
|---|---|---|---|---|---|---|---|---|---|
| open | c1 | c2 | c3 | c4 | c5 | c6 | |||
| m o d e l |
open | 0 | 0 | 0 | 0 | 0 | 0 | 0 | |
| c1 | 0 | 0.005 | 0.068 | 0.155 | 0.063 | 0.014 | 0.007 | ||
| c2 | 0 | 0.002 | 0.067 | 0.196 | 0.099 | 0.024 | 0.006 | ||
| c3 | 0 | 0 | 0.008 | 0.042 | 0.053 | 0.045 | 0.005 | ||
| c4 | 0 | 0 | 0 | 0.005 | 0.015 | 0.044 | 0.037 | ||
| c5 | 0 | 0 | 0 | 0.001 | 0.005 | 0.011 | 0.017 | ||
| c6 | 0 | 0 | 0 | 0 | 0 | 0.002 | 0.002 | ||
See category definitions for details.
Statistical distribution
|
|
Sea ice thickness, day 1 forecast

Day 7 forecast vs. observations
Contingency table
| observations | |||||||||
|---|---|---|---|---|---|---|---|---|---|
| open | c1 | c2 | c3 | c4 | c5 | c6 | |||
| m o d e l |
open | 0 | 0 | 0.001 | 0.001 | 0.001 | 0 | 0 | |
| c1 | 0 | 0.005 | 0.068 | 0.151 | 0.061 | 0.013 | 0.007 | ||
| c2 | 0 | 0.002 | 0.066 | 0.197 | 0.098 | 0.024 | 0.006 | ||
| c3 | 0 | 0 | 0.009 | 0.044 | 0.054 | 0.042 | 0.005 | ||
| c4 | 0 | 0 | 0 | 0.006 | 0.016 | 0.047 | 0.037 | ||
| c5 | 0 | 0 | 0 | 0.001 | 0.005 | 0.011 | 0.018 | ||
| c6 | 0 | 0 | 0 | 0 | 0 | 0.002 | 0.002 | ||
See category definitions for details.
Statistical distribution

|

|
Sea ice thickness, day 7 forecast
Generated by /metno/routine/sms/V2/SIthickness/c2iceWebPage.sh Fri Mar 27 01:08:14 UTC 2020 on arcmfcval