Validation of ice thickness - Full domain
Bulletin date: 2020-01-23
Model: ARC MFC - TOPAZ
Data source: UCL CryoSAT-2 sea ice thickness
Validation statistics summary
| Bias (m) | RMS (m) | total grids | low SIT | OK SIT | high SIT | |
|---|---|---|---|---|---|---|
| Best estimate | -0.78 | 0.94 | 36063 | 13460 | 22575 | 28 |
| Day 1 forecast | -0.78 | 0.94 | 36063 | 13359 | 22675 | 29 |
| Day 4 forecast | -0.78 | 0.95 | 36063 | 13558 | 22475 | 30 |
| Day 7 forecast | -0.76 | 0.92 | 36063 | 12814 | 23217 | 32 |
| Day 10 forecast | -0.78 | 0.94 | 36063 | 13322 | 22719 | 22 |
Numbers in the three rightmost columns are grid counts. Regions with high/low sea ice thickness correspond to areas with model offsets from the gridded observations outside of one standard deviation. (Standard deviations are provided in the observational product.)
Definition of categories:
| Category | Sea ice thickness |
|---|---|
| c1 | <1m |
| c2 | 1 - 1.5m |
| c3 | 1.5 - 2m |
| c4 | 2 - 2.5m |
| c5 | 2.5 - 3m |
| c6 | >3m |
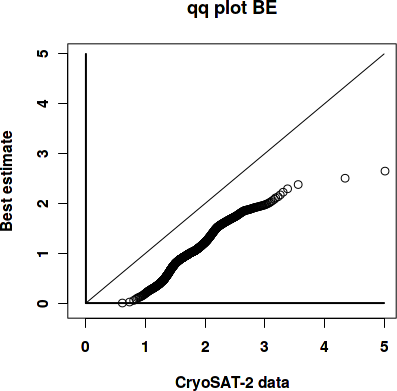
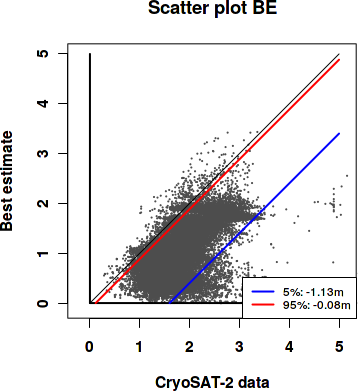
Best estimate vs. observations
Contingency table
| observations | |||||||||
|---|---|---|---|---|---|---|---|---|---|
| open | c1 | c2 | c3 | c4 | c5 | c6 | |||
| m o d e l |
open | 0 | 0 | 0 | 0 | 0 | 0 | 0.001 | |
| c1 | 0 | 0.017 | 0.234 | 0.195 | 0.054 | 0.008 | 0.005 | ||
| c2 | 0 | 0.003 | 0.055 | 0.148 | 0.056 | 0.006 | 0.001 | ||
| c3 | 0 | 0 | 0.002 | 0.033 | 0.086 | 0.062 | 0.013 | ||
| c4 | 0 | 0 | 0 | 0.002 | 0.006 | 0.005 | 0.001 | ||
| c5 | 0 | 0 | 0 | 0 | 0.001 | 0.001 | 0 | ||
| c6 | 0 | 0 | 0 | 0 | 0 | 0 | 0 | ||
See category definitions for details.
Statistical distribution
|
|
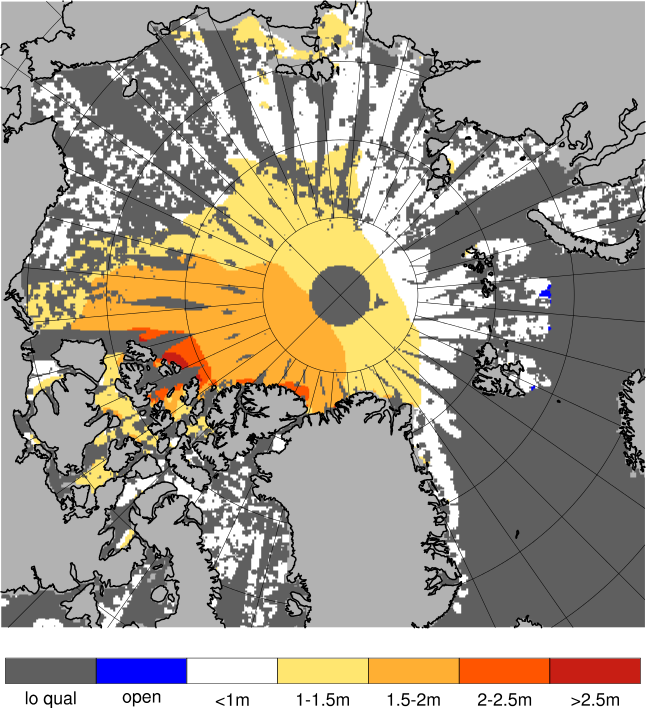
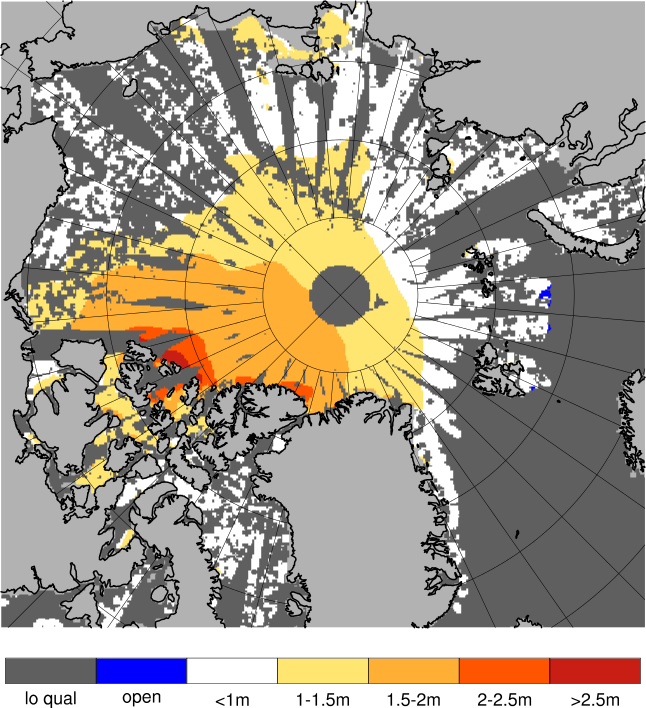
Observed sea ice thickness from CryoSAT
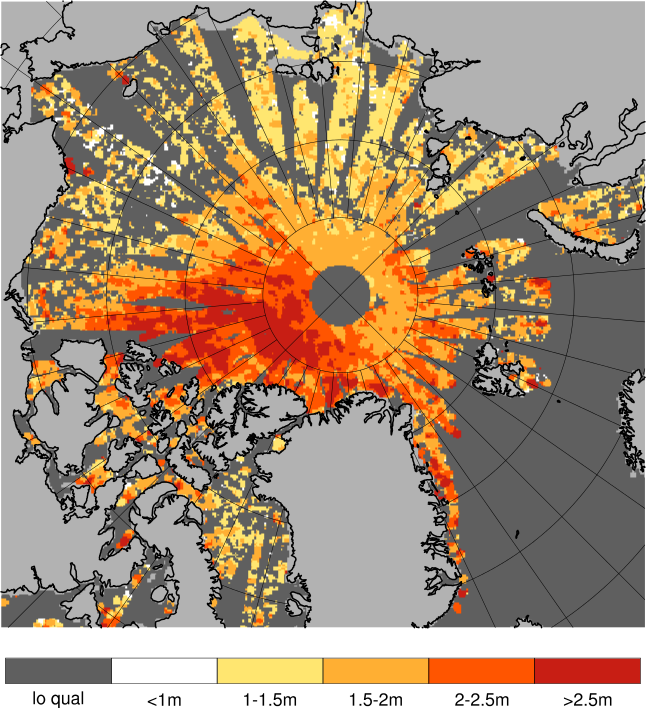
Sea ice thickness, best estimate product

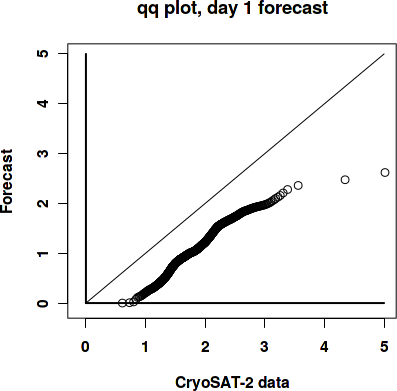
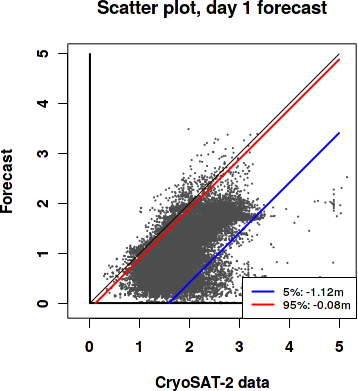
Day 1 forecast vs. observations
Contingency table
| observations | |||||||||
|---|---|---|---|---|---|---|---|---|---|
| open | c1 | c2 | c3 | c4 | c5 | c6 | |||
| m o d e l |
open | 0 | 0 | 0 | 0 | 0.001 | 0.001 | 0.001 | |
| c1 | 0 | 0.017 | 0.233 | 0.194 | 0.053 | 0.008 | 0.005 | ||
| c2 | 0 | 0.003 | 0.056 | 0.149 | 0.056 | 0.006 | 0.001 | ||
| c3 | 0 | 0 | 0.002 | 0.033 | 0.086 | 0.063 | 0.013 | ||
| c4 | 0 | 0 | 0 | 0.002 | 0.006 | 0.006 | 0.002 | ||
| c5 | 0 | 0 | 0 | 0 | 0.001 | 0.001 | 0 | ||
| c6 | 0 | 0 | 0 | 0 | 0 | 0 | 0 | ||
See category definitions for details.
Statistical distribution
|
|
Sea ice thickness, day 1 forecast
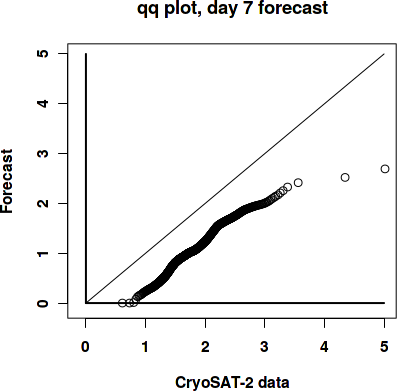
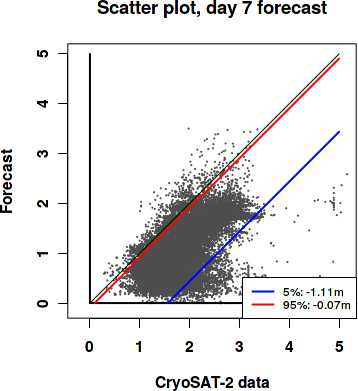
Day 7 forecast vs. observations
Contingency table
| observations | |||||||||
|---|---|---|---|---|---|---|---|---|---|
| open | c1 | c2 | c3 | c4 | c5 | c6 | |||
| m o d e l |
open | 0 | 0 | 0.001 | 0.001 | 0.001 | 0.001 | 0.001 | |
| c1 | 0 | 0.017 | 0.225 | 0.186 | 0.052 | 0.008 | 0.005 | ||
| c2 | 0 | 0.003 | 0.063 | 0.155 | 0.055 | 0.005 | 0.001 | ||
| c3 | 0 | 0 | 0.002 | 0.034 | 0.086 | 0.062 | 0.013 | ||
| c4 | 0 | 0 | 0 | 0.003 | 0.007 | 0.007 | 0.002 | ||
| c5 | 0 | 0 | 0 | 0 | 0.001 | 0.001 | 0 | ||
| c6 | 0 | 0 | 0 | 0 | 0 | 0 | 0 | ||
See category definitions for details.
Statistical distribution
|
|
Sea ice thickness, day 7 forecast
Generated by /metno/routine/sms/V2/SIthickness/c2iceWebPage.sh Fri Feb 7 01:08:28 UTC 2020 on arcmfcval