Validation of ice thickness - Full domain
Bulletin date: 2019-12-05
Model: ARC MFC - TOPAZ
Data source: UCL CryoSAT-2 sea ice thickness
Validation statistics summary
| Bias (m) | RMS (m) | total grids | low SIT | OK SIT | high SIT | |
|---|---|---|---|---|---|---|
| Best estimate | -0.92 | 1.06 | 29267 | 17814 | 11435 | 18 |
| Day 1 forecast | -0.91 | 1.05 | 29267 | 17619 | 11631 | 17 |
| Day 4 forecast | -0.92 | 1.06 | 29267 | 17825 | 11427 | 15 |
| Day 7 forecast | -0.89 | 1.04 | 29267 | 17050 | 12200 | 17 |
| Day 10 forecast | -0.91 | 1.04 | 29267 | 17492 | 11761 | 14 |
Numbers in the three rightmost columns are grid counts. Regions with high/low sea ice thickness correspond to areas with model offsets from the gridded observations outside of one standard deviation. (Standard deviations are provided in the observational product.)
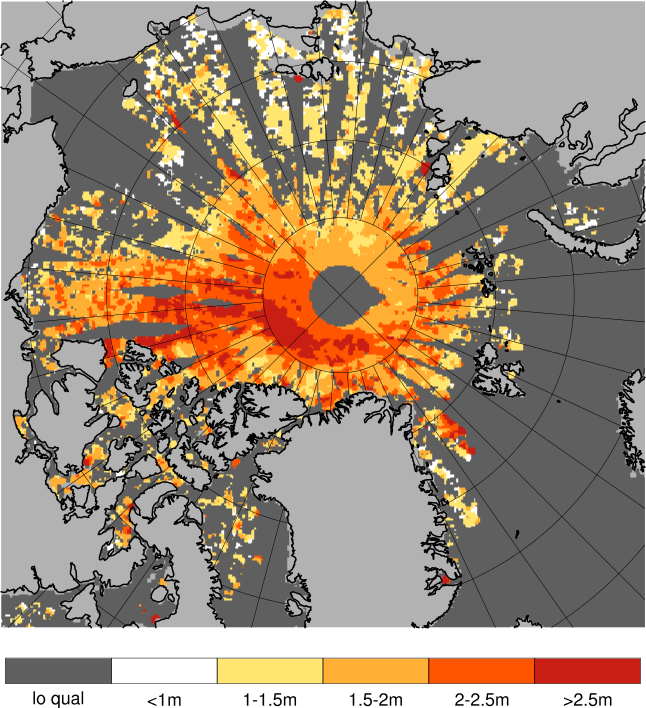
Definition of categories:
| Category | Sea ice thickness |
|---|---|
| c1 | <1m |
| c2 | 1 - 1.5m |
| c3 | 1.5 - 2m |
| c4 | 2 - 2.5m |
| c5 | 2.5 - 3m |
| c6 | >3m |
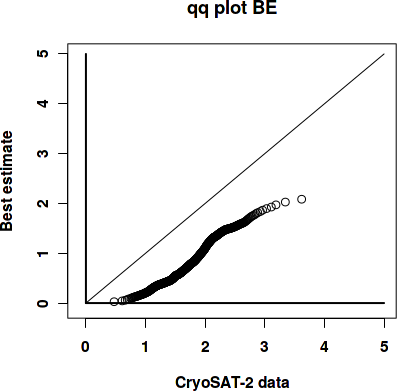
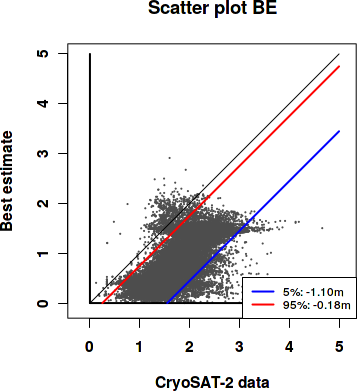
Best estimate vs. observations
Contingency table
| observations | |||||||||
|---|---|---|---|---|---|---|---|---|---|
| open | c1 | c2 | c3 | c4 | c5 | c6 | |||
| m o d e l |
open | 0 | 0 | 0 | 0 | 0 | 0 | 0 | |
| c1 | 0 | 0.064 | 0.274 | 0.249 | 0.066 | 0.009 | 0.004 | ||
| c2 | 0 | 0 | 0.009 | 0.075 | 0.115 | 0.035 | 0.003 | ||
| c3 | 0 | 0 | 0.006 | 0.026 | 0.037 | 0.019 | 0.003 | ||
| c4 | 0 | 0 | 0.001 | 0.002 | 0.001 | 0 | 0 | ||
| c5 | 0 | 0 | 0 | 0 | 0 | 0 | 0 | ||
| c6 | 0 | 0 | 0 | 0 | 0 | 0 | 0 | ||
See category definitions for details.
Statistical distribution
|
|
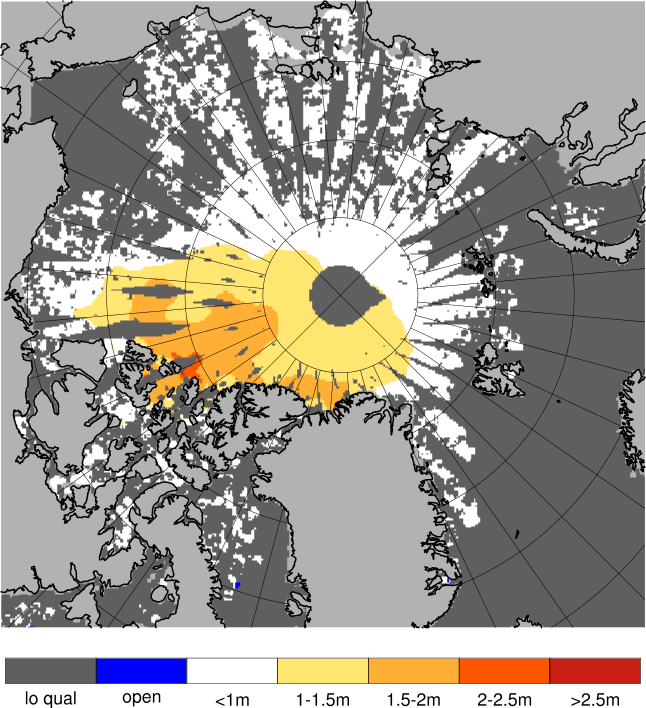
Observed sea ice thickness from CryoSAT
Sea ice thickness, best estimate product

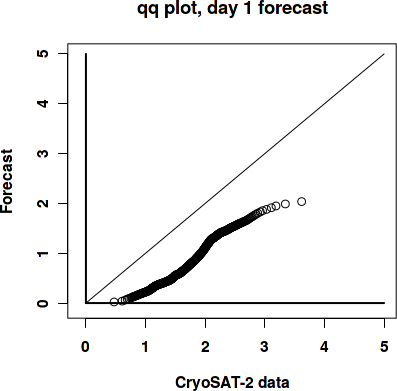
Day 1 forecast vs. observations
Contingency table
| observations | |||||||||
|---|---|---|---|---|---|---|---|---|---|
| open | c1 | c2 | c3 | c4 | c5 | c6 | |||
| m o d e l |
open | 0 | 0 | 0 | 0.001 | 0 | 0 | 0 | |
| c1 | 0 | 0.064 | 0.274 | 0.248 | 0.065 | 0.009 | 0.003 | ||
| c2 | 0 | 0 | 0.009 | 0.075 | 0.114 | 0.034 | 0.003 | ||
| c3 | 0 | 0 | 0.006 | 0.027 | 0.039 | 0.021 | 0.003 | ||
| c4 | 0 | 0 | 0.001 | 0.001 | 0.001 | 0 | 0 | ||
| c5 | 0 | 0 | 0 | 0 | 0 | 0 | 0 | ||
| c6 | 0 | 0 | 0 | 0 | 0 | 0 | 0 | ||
See category definitions for details.
Statistical distribution
|

|
Sea ice thickness, day 1 forecast

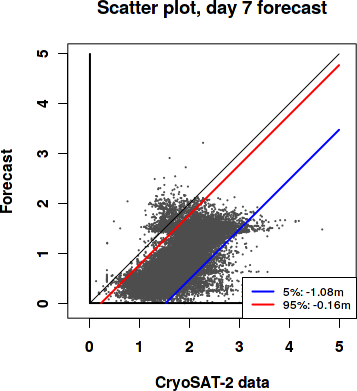
Day 7 forecast vs. observations
Contingency table
| observations | |||||||||
|---|---|---|---|---|---|---|---|---|---|
| open | c1 | c2 | c3 | c4 | c5 | c6 | |||
| m o d e l |
open | 0 | 0 | 0 | 0 | 0 | 0 | 0 | |
| c1 | 0 | 0.064 | 0.273 | 0.245 | 0.065 | 0.009 | 0.003 | ||
| c2 | 0 | 0 | 0.009 | 0.074 | 0.112 | 0.033 | 0.003 | ||
| c3 | 0 | 0 | 0.007 | 0.031 | 0.041 | 0.022 | 0.004 | ||
| c4 | 0 | 0 | 0.001 | 0.002 | 0.001 | 0 | 0 | ||
| c5 | 0 | 0 | 0 | 0 | 0 | 0 | 0 | ||
| c6 | 0 | 0 | 0 | 0 | 0 | 0 | 0 | ||
See category definitions for details.
Statistical distribution

|
|
Sea ice thickness, day 7 forecast
Generated by /metno/routine/sms/V2/SIthickness/c2iceWebPage.sh Fri Dec 20 01:09:00 UTC 2019 on arcmfcval