Validation of ice thickness - Full domain
Bulletin date: 2019-05-09
Model: ARC MFC - TOPAZ
Data source: UCL CryoSAT-2 sea ice thickness
Validation statistics summary
| Bias (m) | RMS (m) | total grids | low SIT | OK SIT | high SIT | |
|---|---|---|---|---|---|---|
| Best estimate | -1.15 | 1.27 | 45458 | 24019 | 21391 | 48 |
| Day 1 forecast | -1.15 | 1.27 | 45458 | 24009 | 21403 | 46 |
| Day 4 forecast | -1.15 | 1.28 | 45458 | 24054 | 21355 | 49 |
| Day 7 forecast | -1.14 | 1.27 | 45458 | 23870 | 21539 | 49 |
| Day 10 forecast | -1.14 | 1.28 | 45458 | 24015 | 21391 | 52 |
Numbers in the three rightmost columns are grid counts. Regions with high/low sea ice thickness correspond to areas with model offsets from the gridded observations outside of one standard deviation. (Standard deviations are provided in the observational product.)
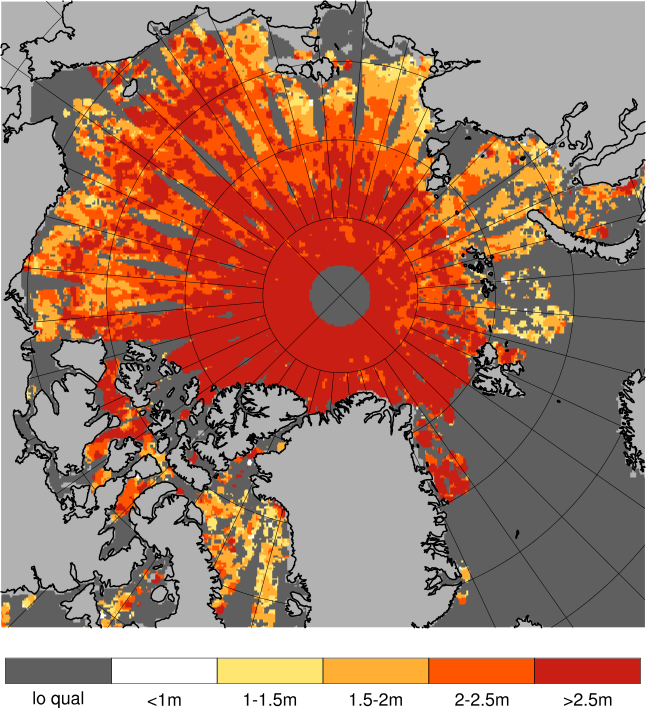
Definition of categories:
| Category | Sea ice thickness |
|---|---|
| c1 | <1m |
| c2 | 1 - 1.5m |
| c3 | 1.5 - 2m |
| c4 | 2 - 2.5m |
| c5 | 2.5 - 3m |
| c6 | >3m |
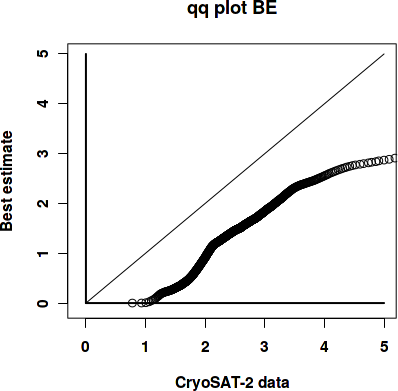
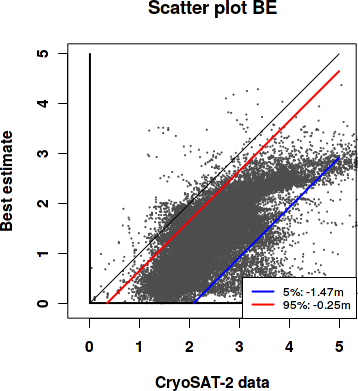
Best estimate vs. observations
Contingency table
| observations | |||||||||
|---|---|---|---|---|---|---|---|---|---|
| open | c1 | c2 | c3 | c4 | c5 | c6 | |||
| m o d e l |
open | 0 | 0 | 0.001 | 0.001 | 0 | 0 | 0.001 | |
| c1 | 0 | 0.003 | 0.047 | 0.132 | 0.055 | 0.018 | 0.016 | ||
| c2 | 0 | 0 | 0.004 | 0.042 | 0.131 | 0.098 | 0.023 | ||
| c3 | 0 | 0 | 0.001 | 0.02 | 0.078 | 0.14 | 0.047 | ||
| c4 | 0 | 0 | 0 | 0.001 | 0.007 | 0.025 | 0.067 | ||
| c5 | 0 | 0 | 0 | 0 | 0 | 0.001 | 0.034 | ||
| c6 | 0 | 0 | 0 | 0 | 0 | 0 | 0.006 | ||
See category definitions for details.
Statistical distribution
|
|
Observed sea ice thickness from CryoSAT
Sea ice thickness, best estimate product

Day 1 forecast vs. observations
Contingency table
| observations | |||||||||
|---|---|---|---|---|---|---|---|---|---|
| open | c1 | c2 | c3 | c4 | c5 | c6 | |||
| m o d e l |
open | 0 | 0 | 0.001 | 0.001 | 0.001 | 0 | 0.001 | |
| c1 | 0 | 0.003 | 0.047 | 0.132 | 0.054 | 0.018 | 0.016 | ||
| c2 | 0 | 0 | 0.004 | 0.041 | 0.132 | 0.099 | 0.024 | ||
| c3 | 0 | 0 | 0.001 | 0.02 | 0.076 | 0.138 | 0.047 | ||
| c4 | 0 | 0 | 0 | 0.001 | 0.007 | 0.025 | 0.067 | ||
| c5 | 0 | 0 | 0 | 0 | 0.001 | 0.002 | 0.033 | ||
| c6 | 0 | 0 | 0 | 0 | 0 | 0 | 0.006 | ||
See category definitions for details.
Statistical distribution

|

|
Sea ice thickness, day 1 forecast

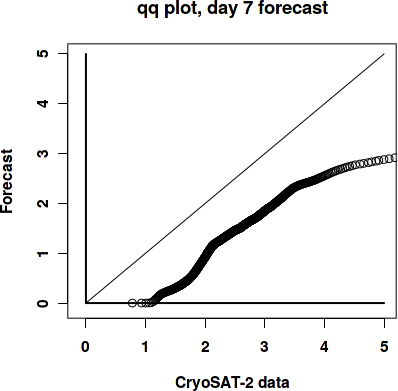
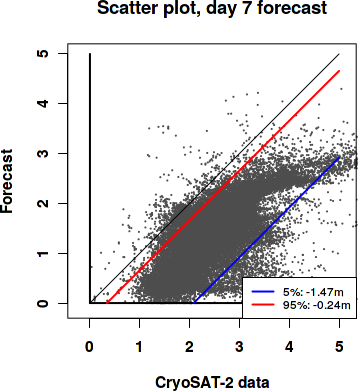
Day 7 forecast vs. observations
Contingency table
| observations | |||||||||
|---|---|---|---|---|---|---|---|---|---|
| open | c1 | c2 | c3 | c4 | c5 | c6 | |||
| m o d e l |
open | 0 | 0 | 0.001 | 0.002 | 0.001 | 0 | 0.001 | |
| c1 | 0 | 0.003 | 0.047 | 0.13 | 0.054 | 0.018 | 0.015 | ||
| c2 | 0 | 0 | 0.004 | 0.042 | 0.133 | 0.099 | 0.024 | ||
| c3 | 0 | 0 | 0.001 | 0.02 | 0.076 | 0.139 | 0.047 | ||
| c4 | 0 | 0 | 0 | 0.001 | 0.007 | 0.025 | 0.067 | ||
| c5 | 0 | 0 | 0 | 0 | 0.001 | 0.002 | 0.034 | ||
| c6 | 0 | 0 | 0 | 0 | 0 | 0 | 0.006 | ||
See category definitions for details.
Statistical distribution
|
|
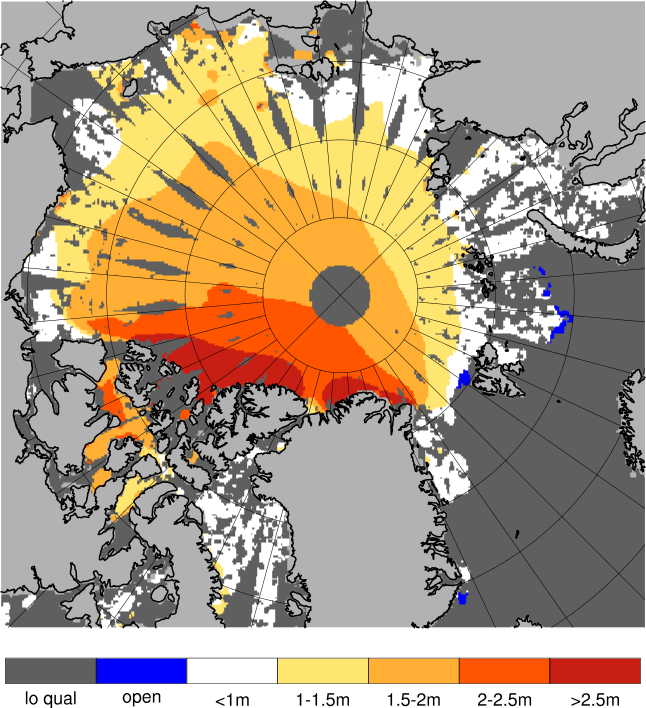
Sea ice thickness, day 7 forecast
Generated by /metno/routine/sms/V2/SIthickness/c2iceWebPage.sh Fri May 24 01:07:32 UTC 2019 on arcmfcval