Validation of ice thickness - Full domain
Bulletin date: 2019-05-02
Model: ARC MFC - TOPAZ
Data source: UCL CryoSAT-2 sea ice thickness
Validation statistics summary
| Bias (m) | RMS (m) | total grids | low SIT | OK SIT | high SIT | |
|---|---|---|---|---|---|---|
| Best estimate | -1.12 | 1.26 | 47110 | 24477 | 22593 | 40 |
| Day 1 forecast | -1.12 | 1.26 | 47110 | 24465 | 22603 | 42 |
| Day 4 forecast | -1.12 | 1.26 | 47110 | 24555 | 22510 | 45 |
| Day 7 forecast | -1.11 | 1.26 | 47110 | 24308 | 22759 | 43 |
| Day 10 forecast | -1.11 | 1.25 | 47110 | 24171 | 22890 | 49 |
Numbers in the three rightmost columns are grid counts. Regions with high/low sea ice thickness correspond to areas with model offsets from the gridded observations outside of one standard deviation. (Standard deviations are provided in the observational product.)
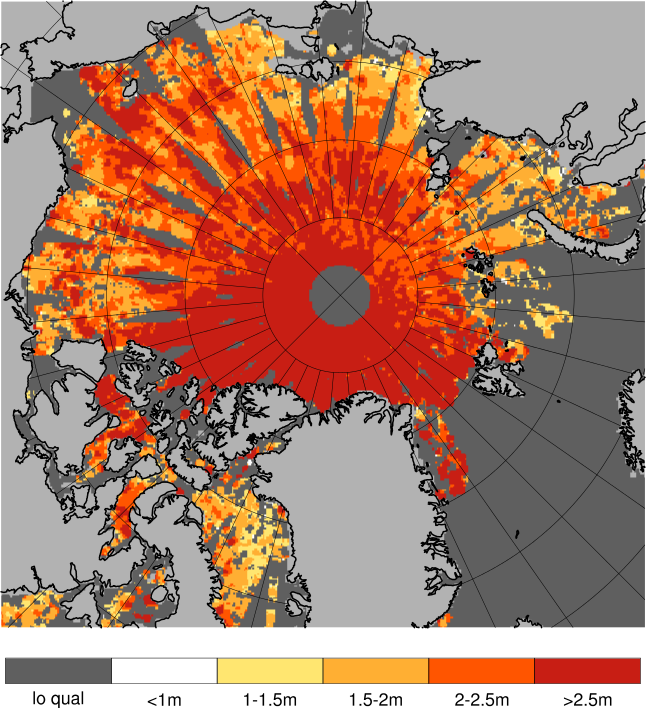
Definition of categories:
| Category | Sea ice thickness |
|---|---|
| c1 | <1m |
| c2 | 1 - 1.5m |
| c3 | 1.5 - 2m |
| c4 | 2 - 2.5m |
| c5 | 2.5 - 3m |
| c6 | >3m |
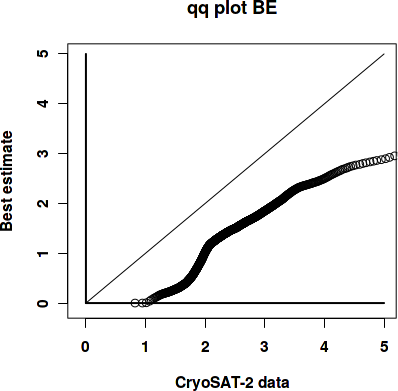
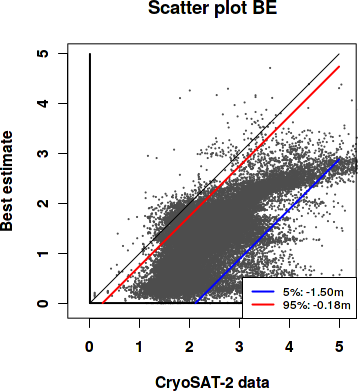
Best estimate vs. observations
Contingency table
| observations | |||||||||
|---|---|---|---|---|---|---|---|---|---|
| open | c1 | c2 | c3 | c4 | c5 | c6 | |||
| m o d e l |
open | 0 | 0 | 0.001 | 0.001 | 0 | 0 | 0 | |
| c1 | 0 | 0.003 | 0.045 | 0.143 | 0.064 | 0.018 | 0.017 | ||
| c2 | 0 | 0 | 0.005 | 0.061 | 0.137 | 0.076 | 0.02 | ||
| c3 | 0 | 0 | 0.002 | 0.035 | 0.086 | 0.114 | 0.036 | ||
| c4 | 0 | 0 | 0 | 0.001 | 0.006 | 0.017 | 0.07 | ||
| c5 | 0 | 0 | 0 | 0 | 0 | 0.001 | 0.033 | ||
| c6 | 0 | 0 | 0 | 0 | 0 | 0.001 | 0.006 | ||
See category definitions for details.
Statistical distribution
|
|
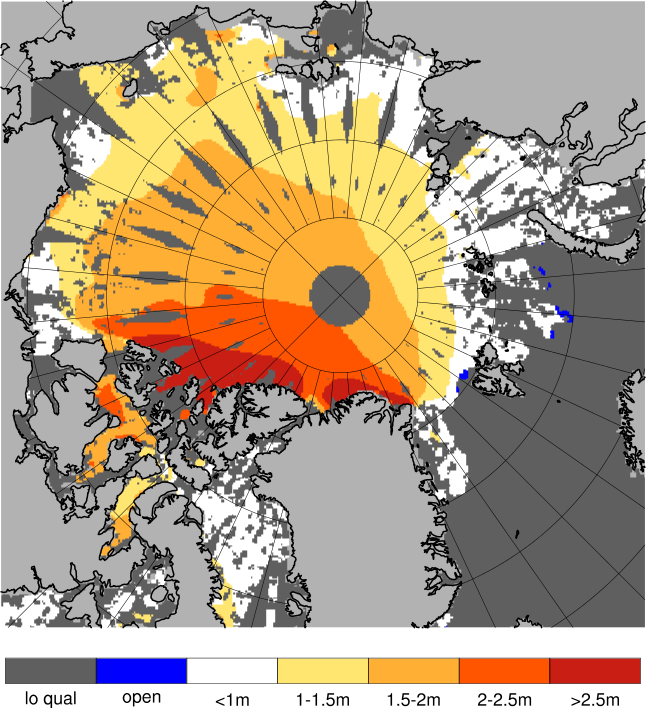
Observed sea ice thickness from CryoSAT
Sea ice thickness, best estimate product

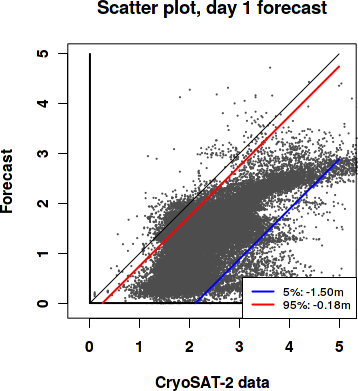
Day 1 forecast vs. observations
Contingency table
| observations | |||||||||
|---|---|---|---|---|---|---|---|---|---|
| open | c1 | c2 | c3 | c4 | c5 | c6 | |||
| m o d e l |
open | 0 | 0 | 0.001 | 0.001 | 0.001 | 0 | 0.001 | |
| c1 | 0 | 0.003 | 0.045 | 0.143 | 0.063 | 0.018 | 0.016 | ||
| c2 | 0 | 0 | 0.005 | 0.061 | 0.14 | 0.077 | 0.02 | ||
| c3 | 0 | 0 | 0.002 | 0.035 | 0.084 | 0.114 | 0.036 | ||
| c4 | 0 | 0 | 0 | 0.001 | 0.006 | 0.017 | 0.069 | ||
| c5 | 0 | 0 | 0 | 0 | 0 | 0.001 | 0.033 | ||
| c6 | 0 | 0 | 0 | 0 | 0 | 0.001 | 0.007 | ||
See category definitions for details.
Statistical distribution

|
|
Sea ice thickness, day 1 forecast
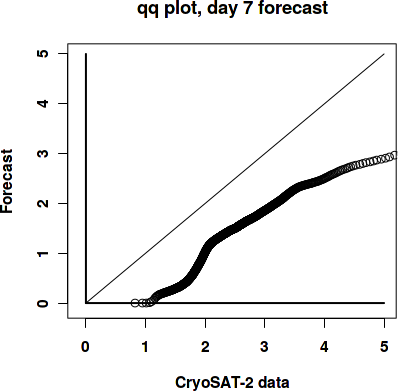
Day 7 forecast vs. observations
Contingency table
| observations | |||||||||
|---|---|---|---|---|---|---|---|---|---|
| open | c1 | c2 | c3 | c4 | c5 | c6 | |||
| m o d e l |
open | 0 | 0 | 0.001 | 0.001 | 0.001 | 0 | 0.001 | |
| c1 | 0 | 0.003 | 0.044 | 0.142 | 0.063 | 0.018 | 0.016 | ||
| c2 | 0 | 0 | 0.005 | 0.061 | 0.139 | 0.076 | 0.019 | ||
| c3 | 0 | 0 | 0.002 | 0.035 | 0.085 | 0.114 | 0.036 | ||
| c4 | 0 | 0 | 0 | 0.002 | 0.006 | 0.017 | 0.07 | ||
| c5 | 0 | 0 | 0 | 0 | 0 | 0.001 | 0.033 | ||
| c6 | 0 | 0 | 0 | 0 | 0 | 0.001 | 0.007 | ||
See category definitions for details.
Statistical distribution
|

|
Sea ice thickness, day 7 forecast

Generated by /metno/routine/sms/V2/SIthickness/c2iceWebPage.sh Fri May 17 01:07:42 UTC 2019 on arcmfcval