Validation of ice thickness - Full domain
Bulletin date: 2019-04-25
Model: ARC MFC - TOPAZ
Data source: UCL CryoSAT-2 sea ice thickness
Validation statistics summary
| Bias (m) | RMS (m) | total grids | low SIT | OK SIT | high SIT | |
|---|---|---|---|---|---|---|
| Best estimate | -1.03 | 1.19 | 48010 | 22975 | 24986 | 49 |
| Day 1 forecast | -1.02 | 1.18 | 48010 | 22767 | 25190 | 53 |
| Day 4 forecast | -1.03 | 1.18 | 48010 | 22829 | 25124 | 57 |
| Day 7 forecast | -1.02 | 1.18 | 48010 | 22448 | 25509 | 53 |
| Day 10 forecast | -1.01 | 1.17 | 48010 | 22086 | 25866 | 58 |
Numbers in the three rightmost columns are grid counts. Regions with high/low sea ice thickness correspond to areas with model offsets from the gridded observations outside of one standard deviation. (Standard deviations are provided in the observational product.)
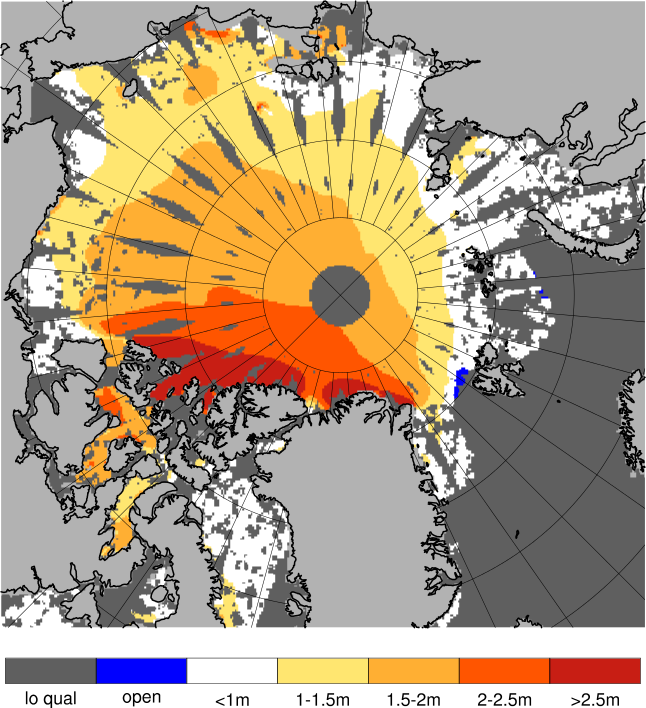
Definition of categories:
| Category | Sea ice thickness |
|---|---|
| c1 | <1m |
| c2 | 1 - 1.5m |
| c3 | 1.5 - 2m |
| c4 | 2 - 2.5m |
| c5 | 2.5 - 3m |
| c6 | >3m |
Best estimate vs. observations
Contingency table
| observations | |||||||||
|---|---|---|---|---|---|---|---|---|---|
| open | c1 | c2 | c3 | c4 | c5 | c6 | |||
| m o d e l |
open | 0 | 0 | 0 | 0.001 | 0 | 0 | 0.001 | |
| c1 | 0 | 0.003 | 0.049 | 0.145 | 0.067 | 0.017 | 0.014 | ||
| c2 | 0 | 0 | 0.006 | 0.09 | 0.149 | 0.049 | 0.014 | ||
| c3 | 0 | 0 | 0.004 | 0.05 | 0.109 | 0.081 | 0.023 | ||
| c4 | 0 | 0 | 0.001 | 0.002 | 0.007 | 0.019 | 0.062 | ||
| c5 | 0 | 0 | 0 | 0 | 0.001 | 0.002 | 0.029 | ||
| c6 | 0 | 0 | 0 | 0 | 0 | 0.001 | 0.006 | ||
See category definitions for details.
Statistical distribution
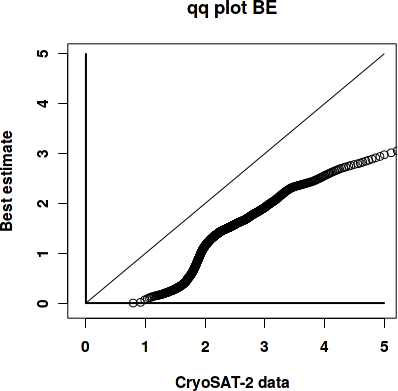
|

|
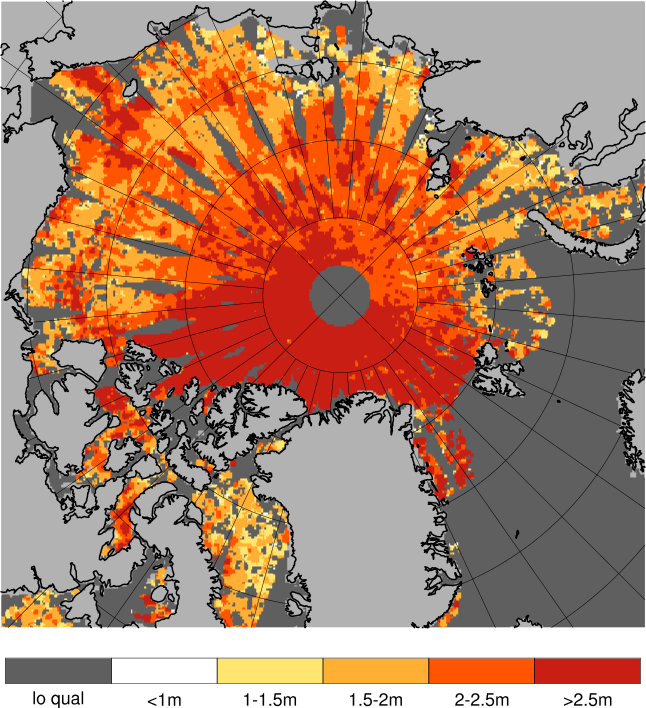
Observed sea ice thickness from CryoSAT
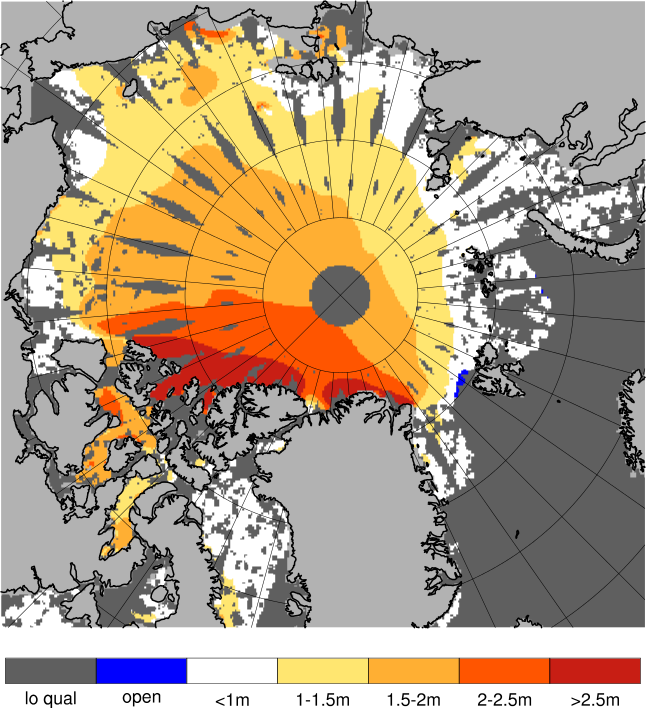
Sea ice thickness, best estimate product

Day 1 forecast vs. observations
Contingency table
| observations | |||||||||
|---|---|---|---|---|---|---|---|---|---|
| open | c1 | c2 | c3 | c4 | c5 | c6 | |||
| m o d e l |
open | 0 | 0 | 0 | 0.001 | 0 | 0 | 0.001 | |
| c1 | 0 | 0.003 | 0.049 | 0.144 | 0.066 | 0.016 | 0.013 | ||
| c2 | 0 | 0 | 0.006 | 0.091 | 0.15 | 0.049 | 0.014 | ||
| c3 | 0 | 0 | 0.004 | 0.049 | 0.108 | 0.082 | 0.023 | ||
| c4 | 0 | 0 | 0.001 | 0.002 | 0.007 | 0.019 | 0.062 | ||
| c5 | 0 | 0 | 0 | 0 | 0.001 | 0.002 | 0.029 | ||
| c6 | 0 | 0 | 0 | 0 | 0 | 0.001 | 0.006 | ||
See category definitions for details.
Statistical distribution

|
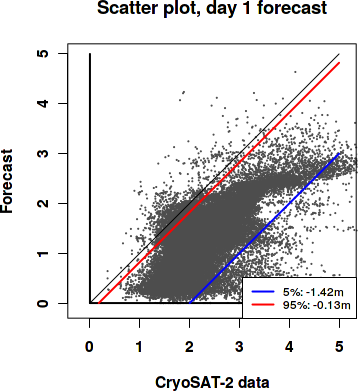
|
Sea ice thickness, day 1 forecast
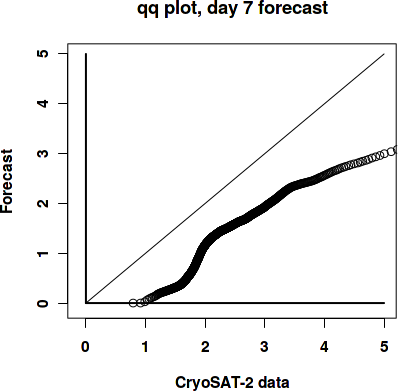
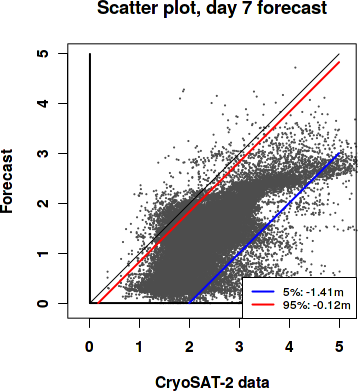
Day 7 forecast vs. observations
Contingency table
| observations | |||||||||
|---|---|---|---|---|---|---|---|---|---|
| open | c1 | c2 | c3 | c4 | c5 | c6 | |||
| m o d e l |
open | 0 | 0 | 0 | 0.001 | 0 | 0 | 0.001 | |
| c1 | 0 | 0.003 | 0.048 | 0.143 | 0.066 | 0.016 | 0.013 | ||
| c2 | 0 | 0 | 0.006 | 0.09 | 0.148 | 0.048 | 0.014 | ||
| c3 | 0 | 0 | 0.004 | 0.05 | 0.11 | 0.082 | 0.023 | ||
| c4 | 0 | 0 | 0.001 | 0.002 | 0.008 | 0.02 | 0.061 | ||
| c5 | 0 | 0 | 0 | 0 | 0.001 | 0.002 | 0.029 | ||
| c6 | 0 | 0 | 0 | 0 | 0 | 0.001 | 0.006 | ||
See category definitions for details.
Statistical distribution
|
|
Sea ice thickness, day 7 forecast
Generated by /metno/routine/sms/V2/SIthickness/c2iceWebPage.sh Fri May 10 01:07:31 UTC 2019 on arcmfcval