Validation of ice thickness - Full domain
Bulletin date: 2019-04-18
Model: ARC MFC - TOPAZ
Data source: UCL CryoSAT-2 sea ice thickness
Validation statistics summary
| Bias (m) | RMS (m) | total grids | low SIT | OK SIT | high SIT | |
|---|---|---|---|---|---|---|
| Best estimate | -1 | 1.15 | 47297 | 21801 | 25411 | 85 |
| Day 1 forecast | -0.99 | 1.13 | 47297 | 21347 | 25864 | 86 |
| Day 4 forecast | -0.99 | 1.14 | 47297 | 21403 | 25803 | 91 |
| Day 7 forecast | -0.98 | 1.12 | 47297 | 20842 | 26371 | 84 |
| Day 10 forecast | -0.96 | 1.11 | 47297 | 20209 | 26988 | 100 |
Numbers in the three rightmost columns are grid counts. Regions with high/low sea ice thickness correspond to areas with model offsets from the gridded observations outside of one standard deviation. (Standard deviations are provided in the observational product.)
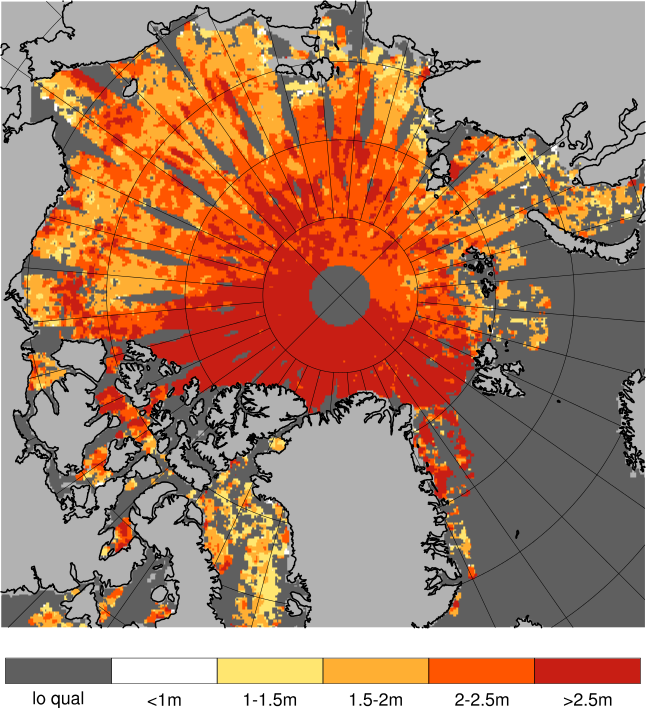
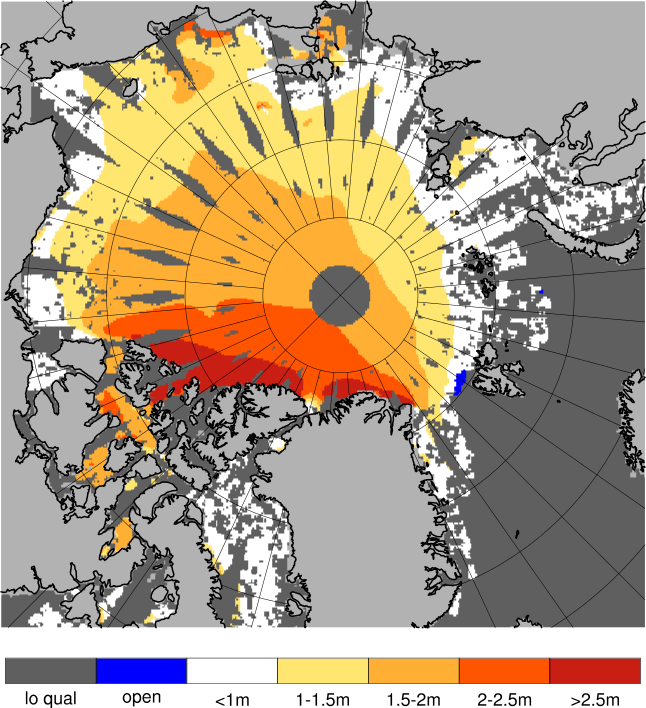
Definition of categories:
| Category | Sea ice thickness |
|---|---|
| c1 | <1m |
| c2 | 1 - 1.5m |
| c3 | 1.5 - 2m |
| c4 | 2 - 2.5m |
| c5 | 2.5 - 3m |
| c6 | >3m |
Best estimate vs. observations
Contingency table
| observations | |||||||||
|---|---|---|---|---|---|---|---|---|---|
| open | c1 | c2 | c3 | c4 | c5 | c6 | |||
| m o d e l |
open | 0 | 0 | 0 | 0 | 0 | 0 | 0.001 | |
| c1 | 0 | 0.004 | 0.059 | 0.147 | 0.062 | 0.014 | 0.011 | ||
| c2 | 0 | 0 | 0.006 | 0.1 | 0.155 | 0.044 | 0.012 | ||
| c3 | 0 | 0 | 0.004 | 0.049 | 0.104 | 0.078 | 0.024 | ||
| c4 | 0 | 0 | 0.001 | 0.001 | 0.008 | 0.022 | 0.057 | ||
| c5 | 0 | 0 | 0 | 0 | 0.001 | 0.001 | 0.027 | ||
| c6 | 0 | 0 | 0 | 0 | 0 | 0 | 0.006 | ||
See category definitions for details.
Statistical distribution
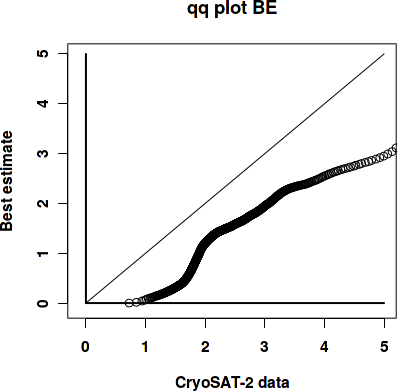
|
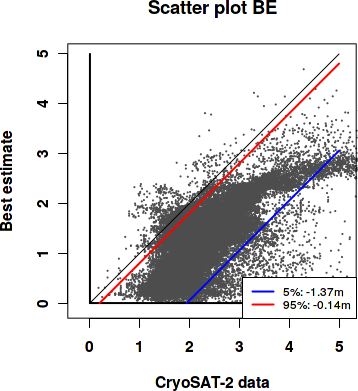
|
Observed sea ice thickness from CryoSAT
Sea ice thickness, best estimate product
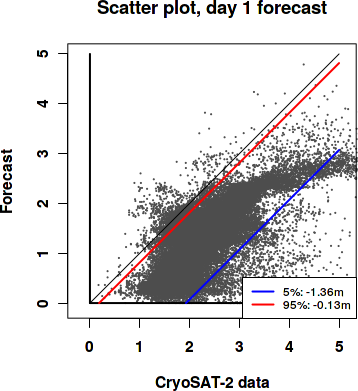
Day 1 forecast vs. observations
Contingency table
| observations | |||||||||
|---|---|---|---|---|---|---|---|---|---|
| open | c1 | c2 | c3 | c4 | c5 | c6 | |||
| m o d e l |
open | 0 | 0 | 0 | 0.001 | 0 | 0 | 0.001 | |
| c1 | 0 | 0.004 | 0.059 | 0.144 | 0.061 | 0.014 | 0.011 | ||
| c2 | 0 | 0 | 0.007 | 0.1 | 0.155 | 0.044 | 0.012 | ||
| c3 | 0 | 0 | 0.004 | 0.051 | 0.105 | 0.078 | 0.024 | ||
| c4 | 0 | 0 | 0.001 | 0.001 | 0.008 | 0.022 | 0.057 | ||
| c5 | 0 | 0 | 0 | 0 | 0.001 | 0.001 | 0.027 | ||
| c6 | 0 | 0 | 0 | 0 | 0 | 0 | 0.006 | ||
See category definitions for details.
Statistical distribution

|
|
Sea ice thickness, day 1 forecast

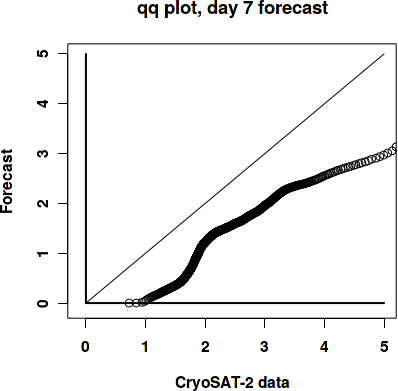
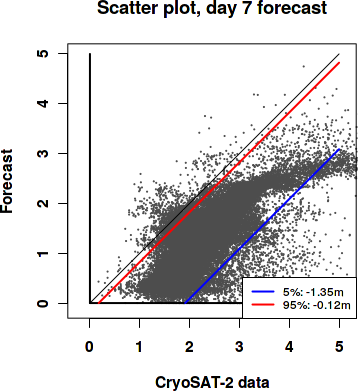
Day 7 forecast vs. observations
Contingency table
| observations | |||||||||
|---|---|---|---|---|---|---|---|---|---|
| open | c1 | c2 | c3 | c4 | c5 | c6 | |||
| m o d e l |
open | 0 | 0 | 0 | 0.001 | 0 | 0 | 0.001 | |
| c1 | 0 | 0.004 | 0.058 | 0.142 | 0.059 | 0.013 | 0.01 | ||
| c2 | 0 | 0 | 0.007 | 0.1 | 0.153 | 0.043 | 0.012 | ||
| c3 | 0 | 0 | 0.004 | 0.052 | 0.108 | 0.079 | 0.024 | ||
| c4 | 0 | 0 | 0.001 | 0.002 | 0.008 | 0.023 | 0.057 | ||
| c5 | 0 | 0 | 0 | 0 | 0.001 | 0.001 | 0.027 | ||
| c6 | 0 | 0 | 0 | 0 | 0 | 0 | 0.006 | ||
See category definitions for details.
Statistical distribution
|
|
Sea ice thickness, day 7 forecast

Generated by /metno/routine/sms/V2/SIthickness/c2iceWebPage.sh Fri May 3 01:07:47 UTC 2019 on arcmfcval