Validation of ice thickness - Full domain
Bulletin date: 2019-02-21
Model: ARC MFC - TOPAZ
Data source: UCL CryoSAT-2 sea ice thickness
Validation statistics summary
| Bias (m) | RMS (m) | total grids | low SIT | OK SIT | high SIT | |
|---|---|---|---|---|---|---|
| Best estimate | -0.85 | 1 | 45953 | 17828 | 28049 | 76 |
| Day 1 forecast | -0.85 | 0.99 | 45953 | 17569 | 28310 | 74 |
| Day 4 forecast | -0.85 | 1 | 45953 | 17738 | 28139 | 76 |
| Day 7 forecast | -0.83 | 0.98 | 45953 | 17062 | 28803 | 88 |
| Day 10 forecast | -0.85 | 1 | 45953 | 17765 | 28104 | 84 |
Numbers in the three rightmost columns are grid counts. Regions with high/low sea ice thickness correspond to areas with model offsets from the gridded observations outside of one standard deviation. (Standard deviations are provided in the observational product.)
Definition of categories:
| Category | Sea ice thickness |
|---|---|
| c1 | <1m |
| c2 | 1 - 1.5m |
| c3 | 1.5 - 2m |
| c4 | 2 - 2.5m |
| c5 | 2.5 - 3m |
| c6 | >3m |
Best estimate vs. observations
Contingency table
| observations | |||||||||
|---|---|---|---|---|---|---|---|---|---|
| open | c1 | c2 | c3 | c4 | c5 | c6 | |||
| m o d e l |
open | 0 | 0 | 0 | 0 | 0 | 0 | 0 | |
| c1 | 0 | 0.006 | 0.094 | 0.127 | 0.041 | 0.014 | 0.006 | ||
| c2 | 0 | 0.001 | 0.074 | 0.282 | 0.11 | 0.034 | 0.006 | ||
| c3 | 0 | 0 | 0.005 | 0.012 | 0.028 | 0.066 | 0.033 | ||
| c4 | 0 | 0 | 0 | 0 | 0.001 | 0.003 | 0.046 | ||
| c5 | 0 | 0 | 0 | 0 | 0.001 | 0.002 | 0.006 | ||
| c6 | 0 | 0 | 0 | 0 | 0 | 0 | 0 | ||
See category definitions for details.
Statistical distribution
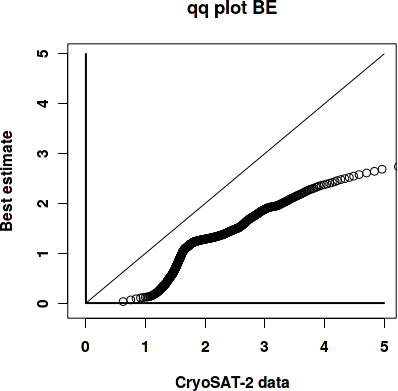
|
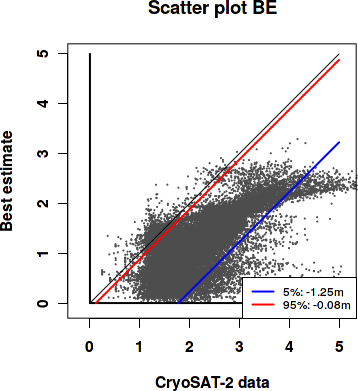
|
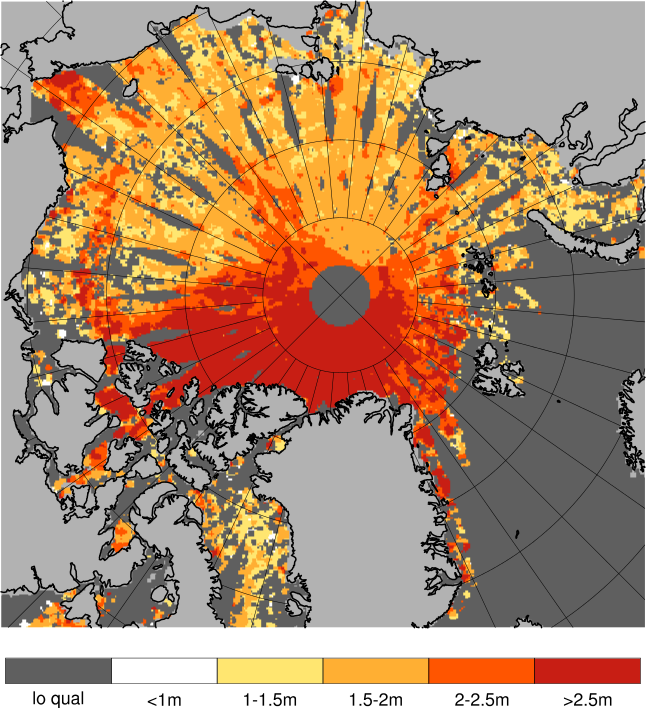
Observed sea ice thickness from CryoSAT
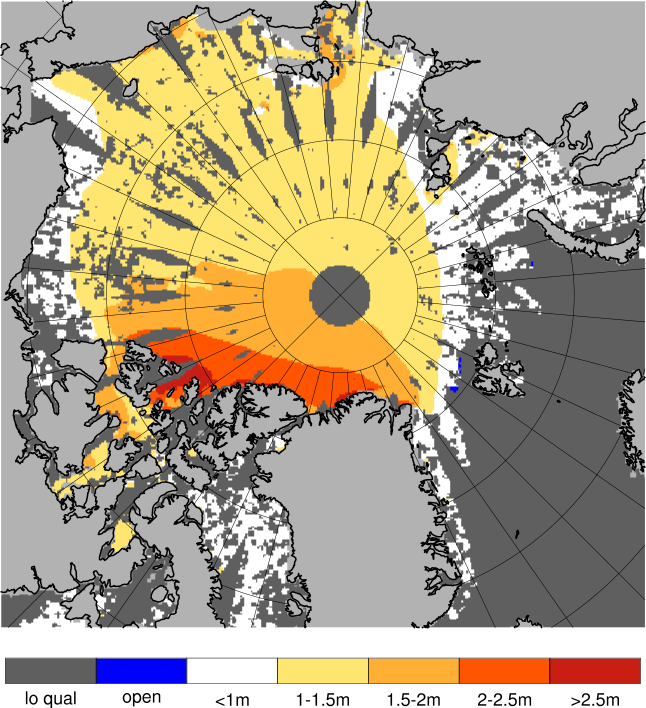
Sea ice thickness, best estimate product
Day 1 forecast vs. observations
Contingency table
| observations | |||||||||
|---|---|---|---|---|---|---|---|---|---|
| open | c1 | c2 | c3 | c4 | c5 | c6 | |||
| m o d e l |
open | 0 | 0 | 0 | 0 | 0 | 0 | 0 | |
| c1 | 0 | 0.006 | 0.095 | 0.128 | 0.041 | 0.013 | 0.006 | ||
| c2 | 0 | 0.001 | 0.073 | 0.281 | 0.11 | 0.035 | 0.006 | ||
| c3 | 0 | 0 | 0.006 | 0.013 | 0.029 | 0.066 | 0.033 | ||
| c4 | 0 | 0 | 0 | 0 | 0.001 | 0.003 | 0.045 | ||
| c5 | 0 | 0 | 0 | 0 | 0.001 | 0.002 | 0.007 | ||
| c6 | 0 | 0 | 0 | 0 | 0 | 0 | 0 | ||
See category definitions for details.
Statistical distribution
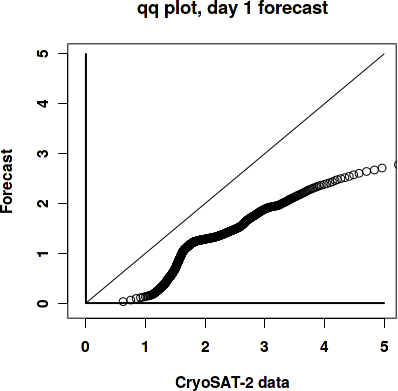
|
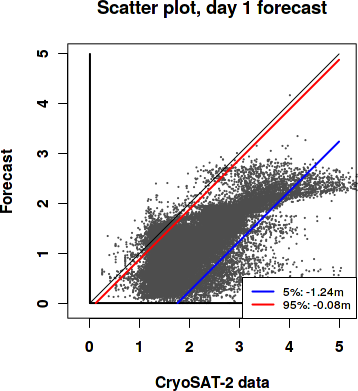
|
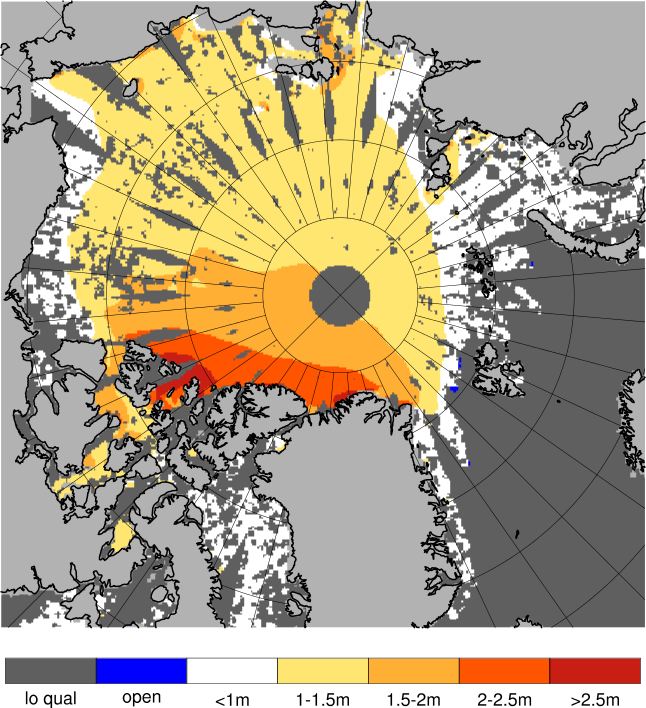
Sea ice thickness, day 1 forecast

Day 7 forecast vs. observations
Contingency table
| observations | |||||||||
|---|---|---|---|---|---|---|---|---|---|
| open | c1 | c2 | c3 | c4 | c5 | c6 | |||
| m o d e l |
open | 0 | 0 | 0 | 0 | 0 | 0 | 0 | |
| c1 | 0 | 0.006 | 0.094 | 0.125 | 0.039 | 0.013 | 0.005 | ||
| c2 | 0 | 0.001 | 0.072 | 0.28 | 0.11 | 0.034 | 0.006 | ||
| c3 | 0 | 0 | 0.008 | 0.016 | 0.031 | 0.067 | 0.032 | ||
| c4 | 0 | 0 | 0 | 0.001 | 0.001 | 0.003 | 0.046 | ||
| c5 | 0 | 0 | 0 | 0 | 0.001 | 0.002 | 0.007 | ||
| c6 | 0 | 0 | 0 | 0 | 0 | 0 | 0 | ||
See category definitions for details.
Statistical distribution

|
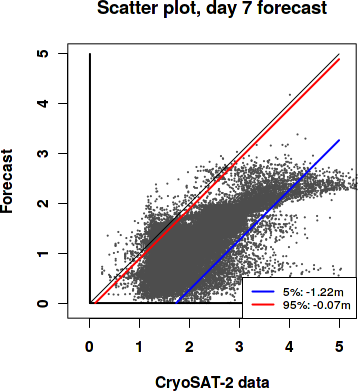
|
Sea ice thickness, day 7 forecast
Generated by /metno/routine/sms/V2/SIthickness/c2iceWebPage.sh Fri Mar 8 01:13:41 UTC 2019 on arcmfcval