Validation of ice thickness - Full domain
Bulletin date: 2019-01-17
Model: ARC MFC - TOPAZ
Data source: UCL CryoSAT-2 sea ice thickness
Validation statistics summary
| Bias (m) | RMS (m) | total grids | low SIT | OK SIT | high SIT | |
|---|---|---|---|---|---|---|
| Best estimate | -0.93 | 1.07 | 39901 | 19936 | 19921 | 44 |
| Day 1 forecast | -0.92 | 1.07 | 39901 | 19773 | 20080 | 48 |
| Day 4 forecast | -0.93 | 1.07 | 39901 | 20019 | 19838 | 44 |
| Day 7 forecast | -0.9 | 1.05 | 39901 | 19116 | 20722 | 63 |
| Day 10 forecast | -0.93 | 1.07 | 39901 | 19902 | 19956 | 43 |
Numbers in the three rightmost columns are grid counts. Regions with high/low sea ice thickness correspond to areas with model offsets from the gridded observations outside of one standard deviation. (Standard deviations are provided in the observational product.)
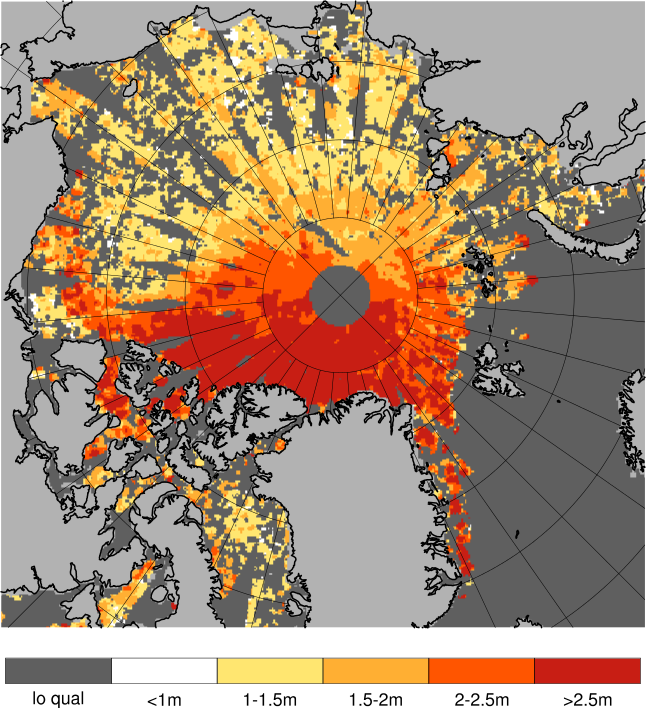
Definition of categories:
| Category | Sea ice thickness |
|---|---|
| c1 | <1m |
| c2 | 1 - 1.5m |
| c3 | 1.5 - 2m |
| c4 | 2 - 2.5m |
| c5 | 2.5 - 3m |
| c6 | >3m |
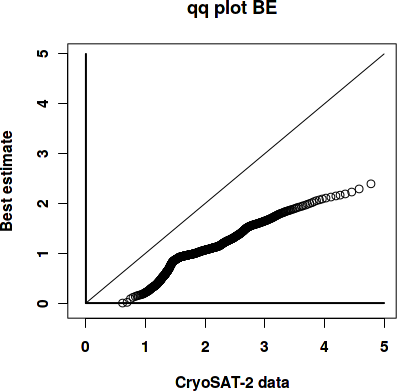
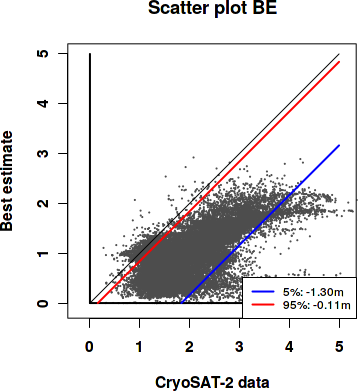
Best estimate vs. observations
Contingency table
| observations | |||||||||
|---|---|---|---|---|---|---|---|---|---|
| open | c1 | c2 | c3 | c4 | c5 | c6 | |||
| m o d e l |
open | 0 | 0.001 | 0 | 0 | 0 | 0 | 0 | |
| c1 | 0 | 0.017 | 0.271 | 0.2 | 0.055 | 0.021 | 0.006 | ||
| c2 | 0 | 0.004 | 0.066 | 0.068 | 0.086 | 0.057 | 0.005 | ||
| c3 | 0 | 0 | 0 | 0.003 | 0.024 | 0.043 | 0.055 | ||
| c4 | 0 | 0 | 0 | 0 | 0.001 | 0.003 | 0.012 | ||
| c5 | 0 | 0 | 0 | 0 | 0 | 0 | 0 | ||
| c6 | 0 | 0 | 0 | 0 | 0 | 0 | 0 | ||
See category definitions for details.
Statistical distribution
|
|
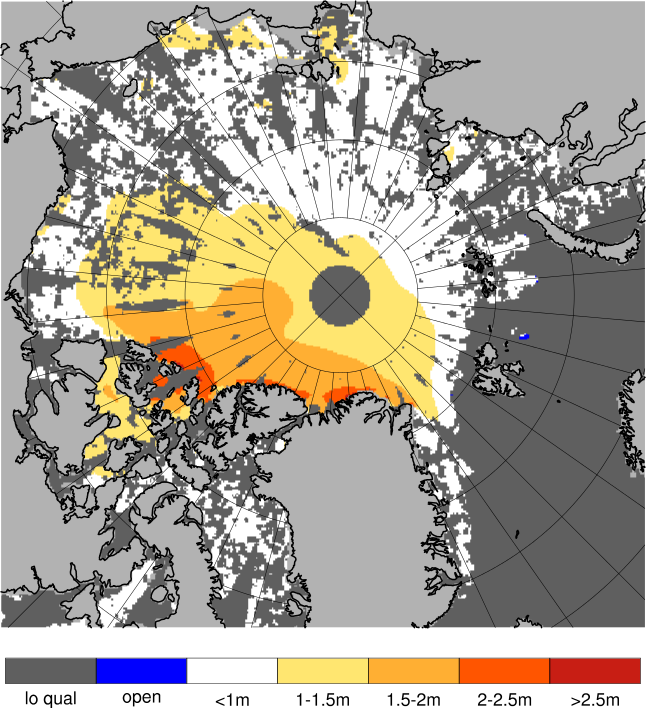
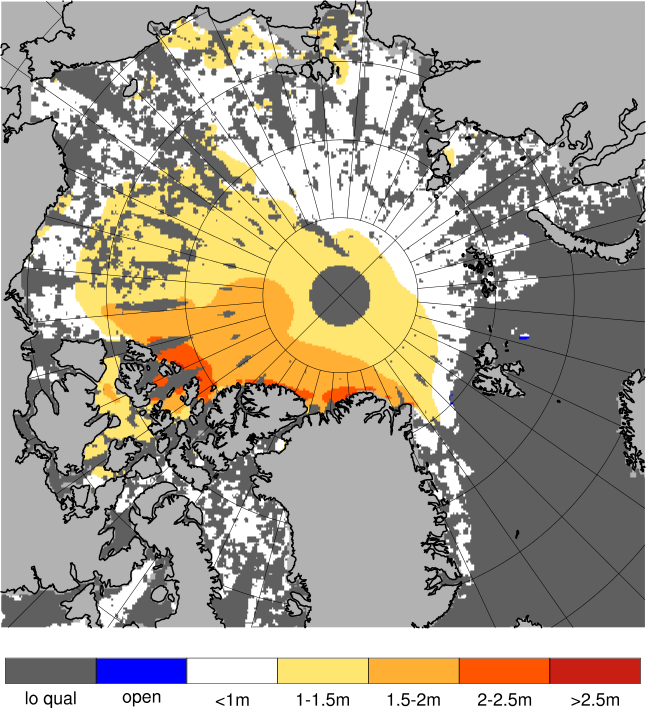
Observed sea ice thickness from CryoSAT
Sea ice thickness, best estimate product

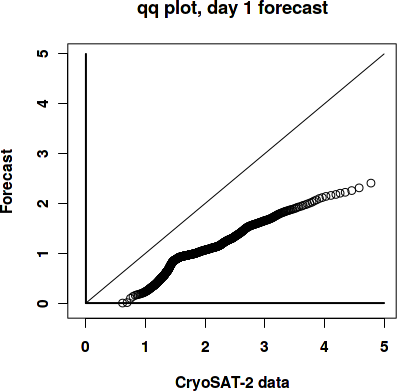
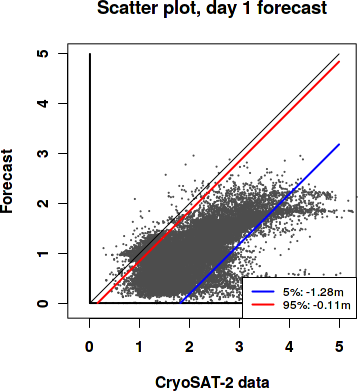
Day 1 forecast vs. observations
Contingency table
| observations | |||||||||
|---|---|---|---|---|---|---|---|---|---|
| open | c1 | c2 | c3 | c4 | c5 | c6 | |||
| m o d e l |
open | 0 | 0.001 | 0 | 0.001 | 0.001 | 0 | 0 | |
| c1 | 0 | 0.017 | 0.272 | 0.2 | 0.055 | 0.021 | 0.006 | ||
| c2 | 0 | 0.004 | 0.066 | 0.068 | 0.084 | 0.056 | 0.005 | ||
| c3 | 0 | 0 | 0 | 0.003 | 0.025 | 0.043 | 0.055 | ||
| c4 | 0 | 0 | 0 | 0 | 0.001 | 0.003 | 0.013 | ||
| c5 | 0 | 0 | 0 | 0 | 0 | 0 | 0 | ||
| c6 | 0 | 0 | 0 | 0 | 0 | 0 | 0 | ||
See category definitions for details.
Statistical distribution
|
|
Sea ice thickness, day 1 forecast
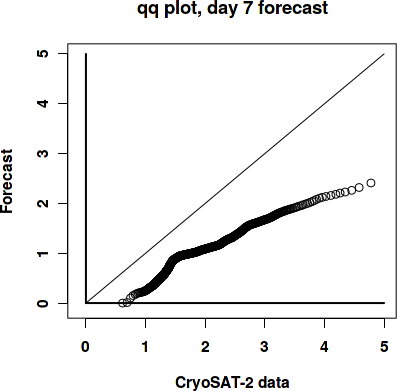
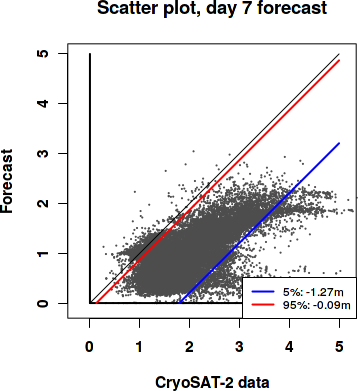
Day 7 forecast vs. observations
Contingency table
| observations | |||||||||
|---|---|---|---|---|---|---|---|---|---|
| open | c1 | c2 | c3 | c4 | c5 | c6 | |||
| m o d e l |
open | 0 | 0.001 | 0 | 0.001 | 0.001 | 0 | 0 | |
| c1 | 0 | 0.015 | 0.252 | 0.19 | 0.053 | 0.02 | 0.006 | ||
| c2 | 0 | 0.005 | 0.086 | 0.077 | 0.084 | 0.055 | 0.004 | ||
| c3 | 0 | 0 | 0 | 0.003 | 0.027 | 0.046 | 0.055 | ||
| c4 | 0 | 0 | 0 | 0 | 0.001 | 0.003 | 0.013 | ||
| c5 | 0 | 0 | 0 | 0 | 0 | 0 | 0 | ||
| c6 | 0 | 0 | 0 | 0 | 0 | 0 | 0 | ||
See category definitions for details.
Statistical distribution
|
|
Sea ice thickness, day 7 forecast
Generated by /metno/routine/sms/V2/SIthickness/c2iceWebPage.sh Fri Feb 1 01:13:56 UTC 2019 on arcmfcval