Validation of ice thickness - Full domain
Bulletin date: 2018-12-27
Model: ARC MFC - TOPAZ
Data source: UCL CryoSAT-2 sea ice thickness
Validation statistics summary
| Bias (m) | RMS (m) | total grids | low SIT | OK SIT | high SIT | |
|---|---|---|---|---|---|---|
| Best estimate | -1.03 | 1.17 | 35743 | 22090 | 13631 | 22 |
| Day 1 forecast | -1.02 | 1.16 | 35743 | 21938 | 13785 | 20 |
| Day 4 forecast | -1.03 | 1.17 | 35743 | 22185 | 13538 | 20 |
| Day 7 forecast | -1 | 1.14 | 35743 | 21360 | 14355 | 28 |
| Day 10 forecast | -1.02 | 1.16 | 35743 | 21969 | 13756 | 18 |
Numbers in the three rightmost columns are grid counts. Regions with high/low sea ice thickness correspond to areas with model offsets from the gridded observations outside of one standard deviation. (Standard deviations are provided in the observational product.)
Definition of categories:
| Category | Sea ice thickness |
|---|---|
| c1 | <1m |
| c2 | 1 - 1.5m |
| c3 | 1.5 - 2m |
| c4 | 2 - 2.5m |
| c5 | 2.5 - 3m |
| c6 | >3m |
Best estimate vs. observations
Contingency table
| observations | |||||||||
|---|---|---|---|---|---|---|---|---|---|
| open | c1 | c2 | c3 | c4 | c5 | c6 | |||
| m o d e l |
open | 0 | 0 | 0 | 0 | 0 | 0 | 0 | |
| c1 | 0 | 0.047 | 0.323 | 0.189 | 0.082 | 0.024 | 0.006 | ||
| c2 | 0 | 0.001 | 0.014 | 0.028 | 0.109 | 0.075 | 0.021 | ||
| c3 | 0 | 0 | 0 | 0.001 | 0.007 | 0.02 | 0.046 | ||
| c4 | 0 | 0 | 0 | 0 | 0 | 0.001 | 0.006 | ||
| c5 | 0 | 0 | 0 | 0 | 0 | 0 | 0 | ||
| c6 | 0 | 0 | 0 | 0 | 0 | 0 | 0 | ||
See category definitions for details.
Statistical distribution
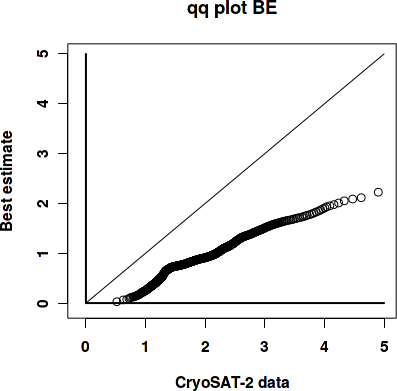
|
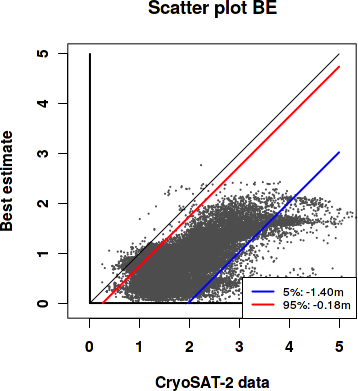
|
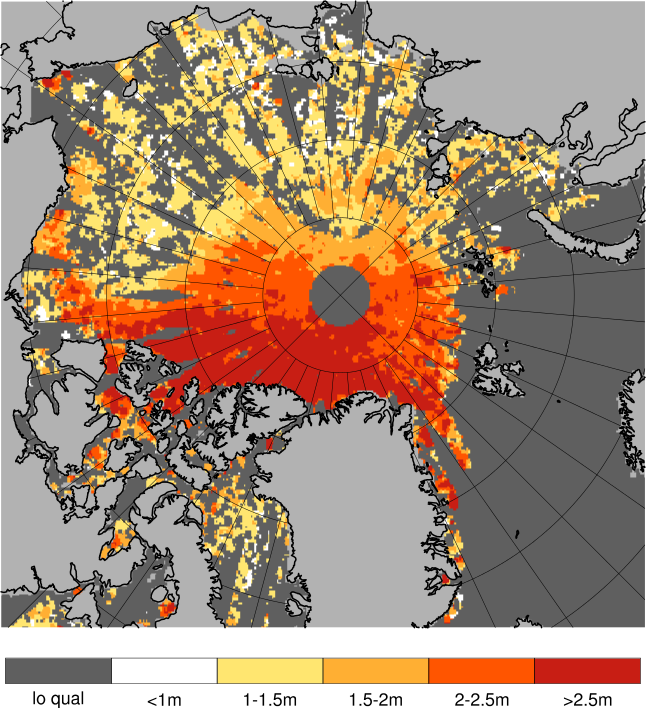
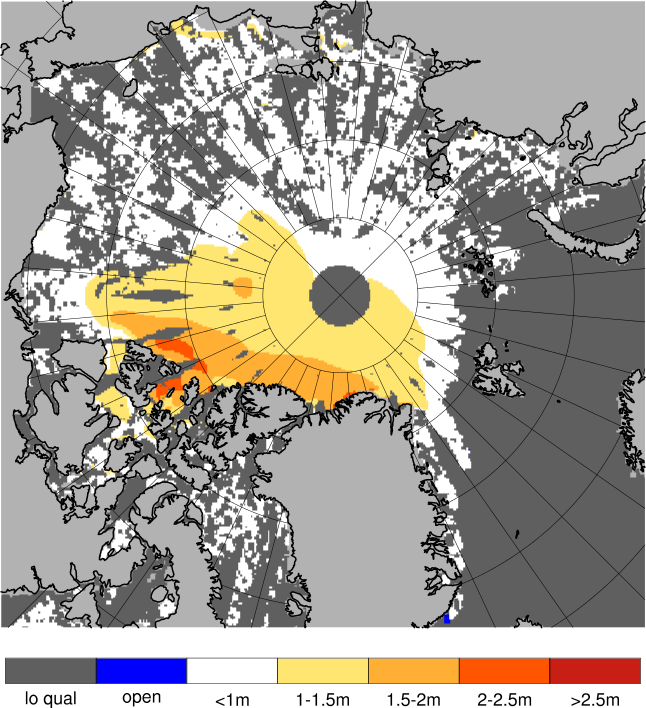
Observed sea ice thickness from CryoSAT
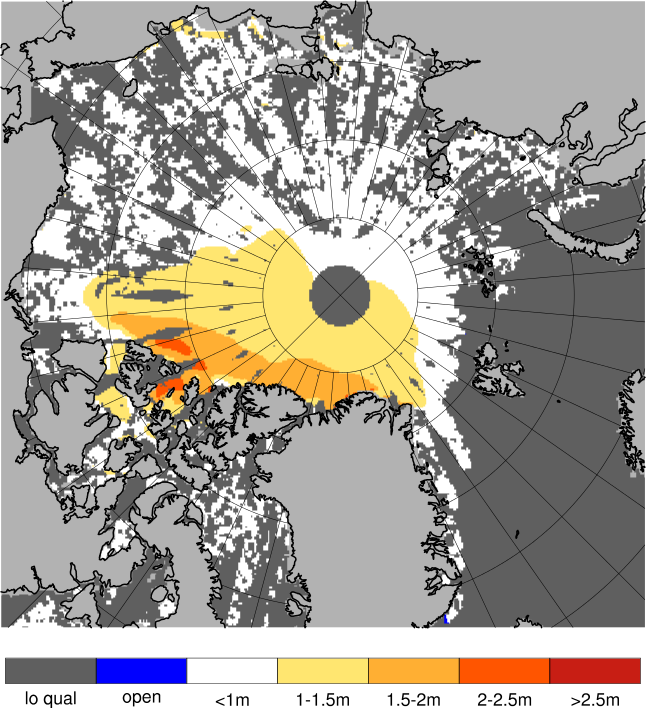
Sea ice thickness, best estimate product
Day 1 forecast vs. observations
Contingency table
| observations | |||||||||
|---|---|---|---|---|---|---|---|---|---|
| open | c1 | c2 | c3 | c4 | c5 | c6 | |||
| m o d e l |
open | 0 | 0 | 0 | 0 | 0.001 | 0 | 0 | |
| c1 | 0 | 0.047 | 0.323 | 0.186 | 0.081 | 0.023 | 0.006 | ||
| c2 | 0 | 0.001 | 0.014 | 0.031 | 0.108 | 0.075 | 0.02 | ||
| c3 | 0 | 0 | 0 | 0.001 | 0.009 | 0.02 | 0.047 | ||
| c4 | 0 | 0 | 0 | 0 | 0 | 0.001 | 0.006 | ||
| c5 | 0 | 0 | 0 | 0 | 0 | 0 | 0 | ||
| c6 | 0 | 0 | 0 | 0 | 0 | 0 | 0 | ||
See category definitions for details.
Statistical distribution
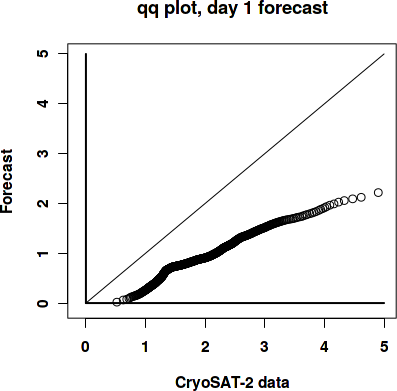
|
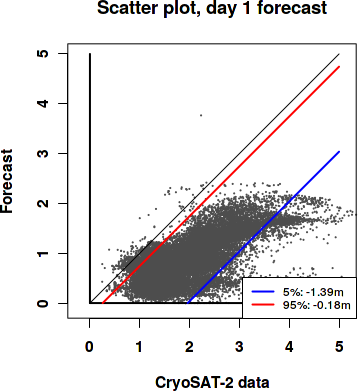
|
Sea ice thickness, day 1 forecast

Day 7 forecast vs. observations
Contingency table
| observations | |||||||||
|---|---|---|---|---|---|---|---|---|---|
| open | c1 | c2 | c3 | c4 | c5 | c6 | |||
| m o d e l |
open | 0 | 0 | 0 | 0 | 0.001 | 0 | 0 | |
| c1 | 0 | 0.047 | 0.322 | 0.181 | 0.079 | 0.022 | 0.006 | ||
| c2 | 0 | 0.001 | 0.015 | 0.036 | 0.108 | 0.073 | 0.017 | ||
| c3 | 0 | 0 | 0 | 0.001 | 0.011 | 0.023 | 0.049 | ||
| c4 | 0 | 0 | 0 | 0 | 0 | 0.001 | 0.007 | ||
| c5 | 0 | 0 | 0 | 0 | 0 | 0 | 0 | ||
| c6 | 0 | 0 | 0 | 0 | 0 | 0 | 0 | ||
See category definitions for details.
Statistical distribution
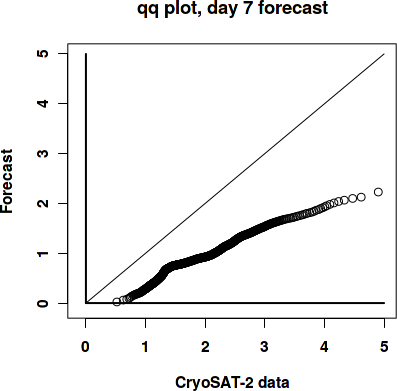
|
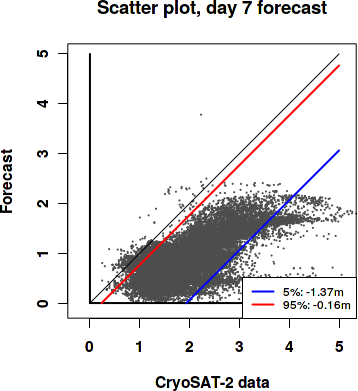
|
Sea ice thickness, day 7 forecast
Generated by /metno/routine/sms/V2/SIthickness/c2iceWebPage.sh Fri Jan 11 03:53:58 UTC 2019 on arcmfcval