Validation of ice thickness - Full domain
Bulletin date: 2018-10-18
Model: ARC MFC - TOPAZ
Data source: UCL CryoSAT-2 sea ice thickness
Validation statistics summary
| Bias (m) | RMS (m) | total grids | low SIT | OK SIT | high SIT | |
|---|---|---|---|---|---|---|
| Best estimate | -0.97 | 1.06 | 18120 | 12094 | 5947 | 79 |
| Day 1 forecast | -0.96 | 1.06 | 18120 | 11995 | 6045 | 80 |
| Day 4 forecast | -0.97 | 1.06 | 18120 | 11991 | 6050 | 79 |
| Day 7 forecast | -0.96 | 1.05 | 18120 | 11994 | 6047 | 79 |
| Day 10 forecast | -0.97 | 1.06 | 18120 | 11941 | 6104 | 75 |
Numbers in the three rightmost columns are grid counts. Regions with high/low sea ice thickness correspond to areas with model offsets from the gridded observations outside of one standard deviation. (Standard deviations are provided in the observational product.)
Definition of categories:
| Category | Sea ice thickness |
|---|---|
| c1 | <1m |
| c2 | 1 - 1.5m |
| c3 | 1.5 - 2m |
| c4 | 2 - 2.5m |
| c5 | 2.5 - 3m |
| c6 | >3m |
Best estimate vs. observations
Contingency table
| observations | |||||||||
|---|---|---|---|---|---|---|---|---|---|
| open | c1 | c2 | c3 | c4 | c5 | c6 | |||
| m o d e l |
open | 0 | 0 | 0 | 0 | 0 | 0 | 0 | |
| c1 | 0 | 0.042 | 0.235 | 0.314 | 0.144 | 0.013 | 0.002 | ||
| c2 | 0 | 0 | 0.01 | 0.065 | 0.084 | 0.031 | 0.004 | ||
| c3 | 0 | 0.001 | 0.001 | 0.01 | 0.014 | 0.008 | 0.004 | ||
| c4 | 0 | 0 | 0.001 | 0.005 | 0.005 | 0.002 | 0.002 | ||
| c5 | 0 | 0 | 0 | 0.001 | 0.001 | 0 | 0.001 | ||
| c6 | 0 | 0 | 0 | 0 | 0 | 0 | 0.001 | ||
See category definitions for details.
Statistical distribution
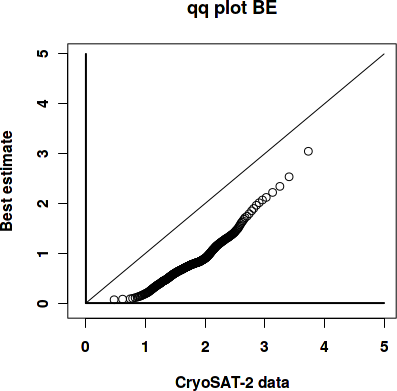
|

|
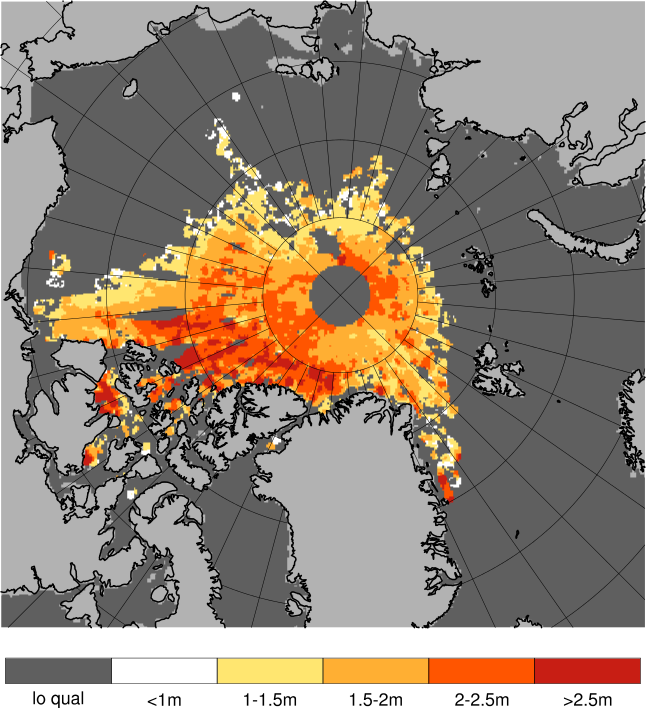
Observed sea ice thickness from CryoSAT
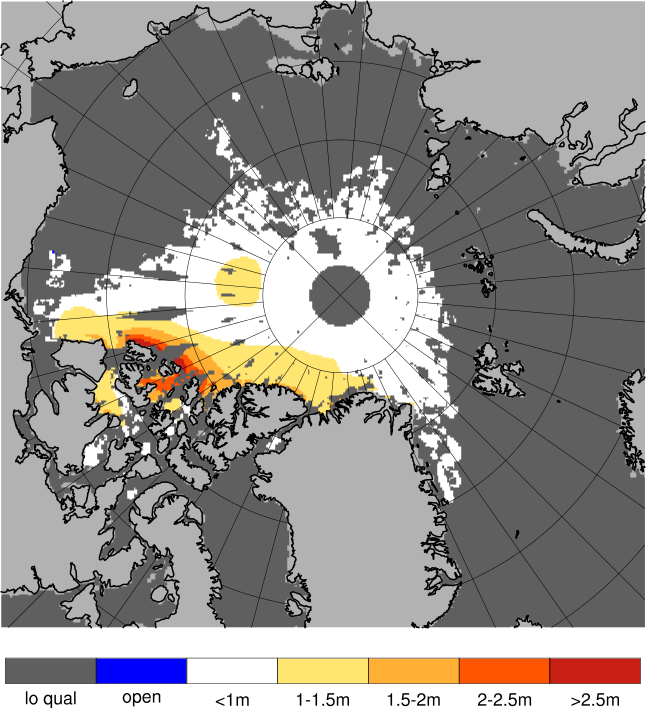
Sea ice thickness, best estimate product

Day 1 forecast vs. observations
Contingency table
| observations | |||||||||
|---|---|---|---|---|---|---|---|---|---|
| open | c1 | c2 | c3 | c4 | c5 | c6 | |||
| m o d e l |
open | 0 | 0 | 0 | 0 | 0 | 0 | 0 | |
| c1 | 0 | 0.042 | 0.235 | 0.31 | 0.143 | 0.013 | 0.002 | ||
| c2 | 0 | 0 | 0.01 | 0.068 | 0.084 | 0.031 | 0.004 | ||
| c3 | 0 | 0.001 | 0.002 | 0.011 | 0.015 | 0.007 | 0.003 | ||
| c4 | 0 | 0 | 0.001 | 0.005 | 0.005 | 0.002 | 0.002 | ||
| c5 | 0 | 0 | 0 | 0.001 | 0.001 | 0 | 0.001 | ||
| c6 | 0 | 0 | 0 | 0 | 0 | 0 | 0.001 | ||
See category definitions for details.
Statistical distribution

|
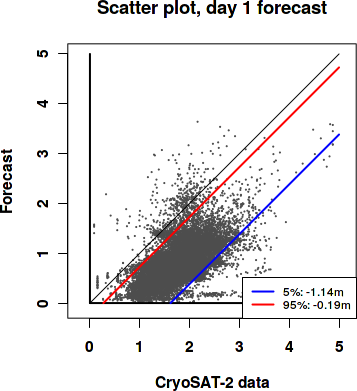
|
Sea ice thickness, day 1 forecast
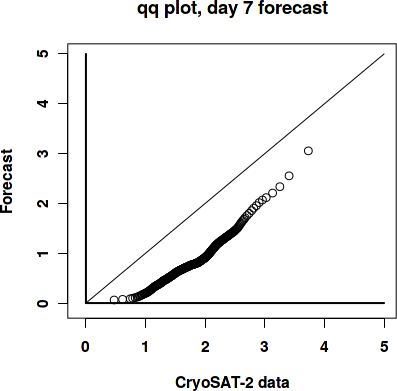
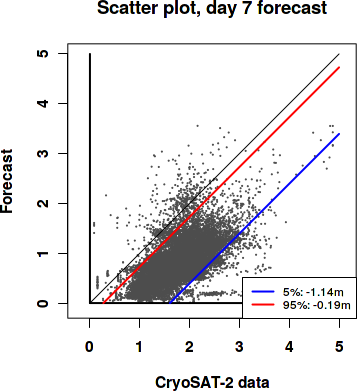
Day 7 forecast vs. observations
Contingency table
| observations | |||||||||
|---|---|---|---|---|---|---|---|---|---|
| open | c1 | c2 | c3 | c4 | c5 | c6 | |||
| m o d e l |
open | 0 | 0 | 0 | 0 | 0 | 0 | 0 | |
| c1 | 0 | 0.042 | 0.234 | 0.309 | 0.14 | 0.013 | 0.002 | ||
| c2 | 0 | 0 | 0.011 | 0.069 | 0.085 | 0.031 | 0.005 | ||
| c3 | 0 | 0.001 | 0.002 | 0.011 | 0.016 | 0.008 | 0.003 | ||
| c4 | 0 | 0 | 0.001 | 0.005 | 0.005 | 0.002 | 0.002 | ||
| c5 | 0 | 0 | 0 | 0.001 | 0.001 | 0 | 0.001 | ||
| c6 | 0 | 0 | 0 | 0 | 0 | 0 | 0.001 | ||
See category definitions for details.
Statistical distribution
|
|
Sea ice thickness, day 7 forecast

Generated by /metno/routine/sms/V2/SIthickness/c2iceWebPage.sh Fri Nov 2 03:53:12 UTC 2018 on arcmfcval