Validation of ice thickness - Full domain
Bulletin date: 2018-10-11
Model: ARC MFC - TOPAZ
Data source: UCL CryoSAT-2 sea ice thickness
Validation statistics summary
| Bias (m) | RMS (m) | total grids | low SIT | OK SIT | high SIT | |
|---|---|---|---|---|---|---|
| Best estimate | -0.91 | 1.01 | 15695 | 9215 | 6397 | 83 |
| Day 1 forecast | -0.9 | 1.01 | 15695 | 9121 | 6492 | 82 |
| Day 4 forecast | -0.9 | 1.01 | 15695 | 9107 | 6507 | 81 |
| Day 7 forecast | -0.9 | 1.01 | 15695 | 9119 | 6493 | 83 |
| Day 10 forecast | -0.9 | 1 | 15695 | 9039 | 6587 | 69 |
Numbers in the three rightmost columns are grid counts. Regions with high/low sea ice thickness correspond to areas with model offsets from the gridded observations outside of one standard deviation. (Standard deviations are provided in the observational product.)
Definition of categories:
| Category | Sea ice thickness |
|---|---|
| c1 | <1m |
| c2 | 1 - 1.5m |
| c3 | 1.5 - 2m |
| c4 | 2 - 2.5m |
| c5 | 2.5 - 3m |
| c6 | >3m |
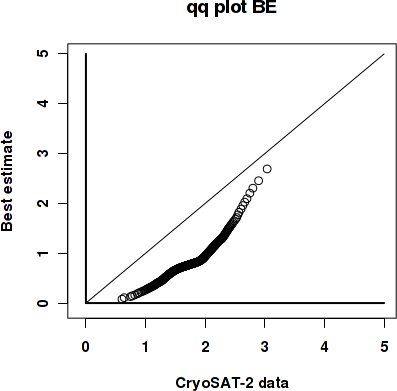
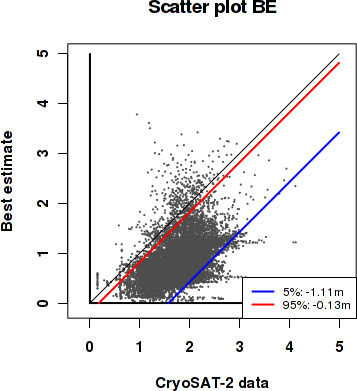
Best estimate vs. observations
Contingency table
| observations | |||||||||
|---|---|---|---|---|---|---|---|---|---|
| open | c1 | c2 | c3 | c4 | c5 | c6 | |||
| m o d e l |
open | 0 | 0 | 0 | 0 | 0 | 0 | 0 | |
| c1 | 0 | 0.034 | 0.261 | 0.299 | 0.14 | 0.007 | 0 | ||
| c2 | 0 | 0.001 | 0.014 | 0.068 | 0.088 | 0.023 | 0.002 | ||
| c3 | 0 | 0 | 0.002 | 0.017 | 0.019 | 0.004 | 0 | ||
| c4 | 0 | 0 | 0.001 | 0.006 | 0.006 | 0.001 | 0.001 | ||
| c5 | 0 | 0 | 0 | 0.001 | 0.002 | 0.001 | 0 | ||
| c6 | 0 | 0 | 0 | 0 | 0 | 0 | 0 | ||
See category definitions for details.
Statistical distribution
|
|
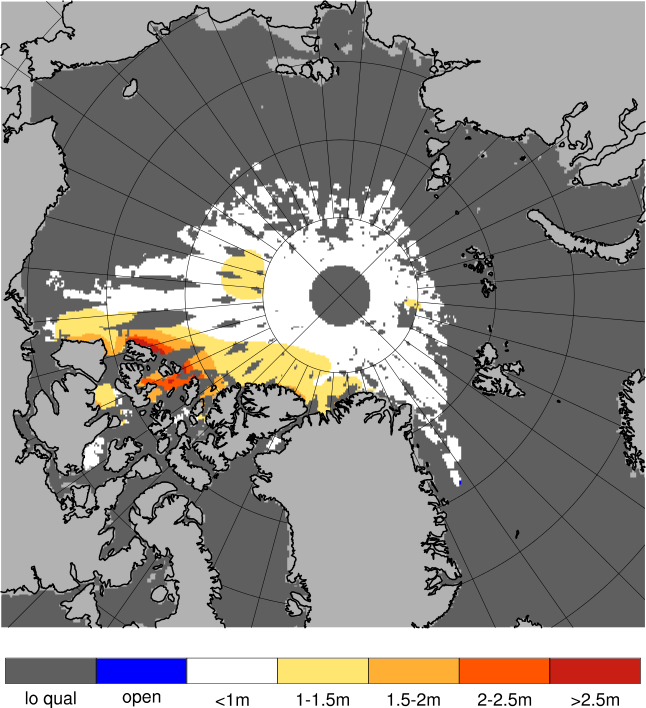
Observed sea ice thickness from CryoSAT
Sea ice thickness, best estimate product

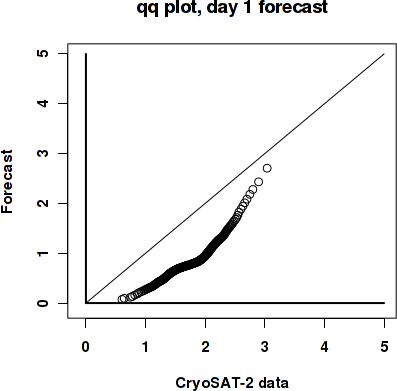
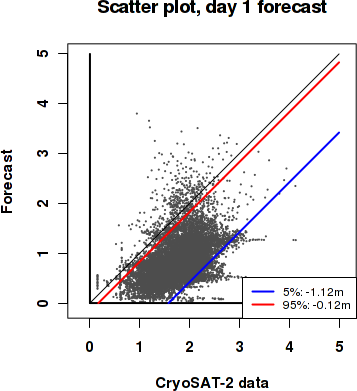
Day 1 forecast vs. observations
Contingency table
| observations | |||||||||
|---|---|---|---|---|---|---|---|---|---|
| open | c1 | c2 | c3 | c4 | c5 | c6 | |||
| m o d e l |
open | 0 | 0 | 0 | 0 | 0 | 0 | 0 | |
| c1 | 0 | 0.034 | 0.261 | 0.295 | 0.139 | 0.008 | 0 | ||
| c2 | 0 | 0.001 | 0.015 | 0.072 | 0.088 | 0.023 | 0.002 | ||
| c3 | 0 | 0 | 0.002 | 0.018 | 0.02 | 0.004 | 0 | ||
| c4 | 0 | 0 | 0.001 | 0.006 | 0.006 | 0.001 | 0.001 | ||
| c5 | 0 | 0 | 0 | 0.001 | 0.001 | 0 | 0 | ||
| c6 | 0 | 0 | 0 | 0 | 0 | 0 | 0 | ||
See category definitions for details.
Statistical distribution
|
|
Sea ice thickness, day 1 forecast
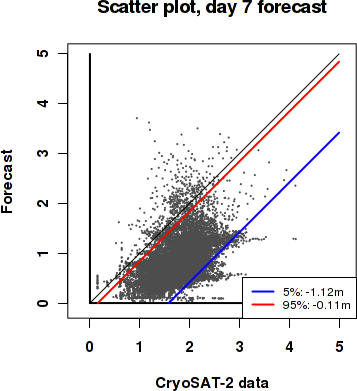
Day 7 forecast vs. observations
Contingency table
| observations | |||||||||
|---|---|---|---|---|---|---|---|---|---|
| open | c1 | c2 | c3 | c4 | c5 | c6 | |||
| m o d e l |
open | 0 | 0 | 0 | 0 | 0 | 0 | 0 | |
| c1 | 0 | 0.034 | 0.26 | 0.295 | 0.137 | 0.008 | 0 | ||
| c2 | 0 | 0.001 | 0.015 | 0.071 | 0.09 | 0.023 | 0.002 | ||
| c3 | 0 | 0 | 0.002 | 0.018 | 0.02 | 0.004 | 0 | ||
| c4 | 0 | 0 | 0.001 | 0.006 | 0.007 | 0.001 | 0.001 | ||
| c5 | 0 | 0 | 0 | 0.002 | 0.001 | 0 | 0 | ||
| c6 | 0 | 0 | 0 | 0 | 0 | 0.001 | 0 | ||
See category definitions for details.
Statistical distribution

|
|
Sea ice thickness, day 7 forecast

Generated by /metno/routine/sms/V2/SIthickness/c2iceWebPage.sh Fri Oct 26 03:52:55 UTC 2018 on arcmfcval