Validation of ice thickness - Full domain
Bulletin date: 2018-04-12
Model: ARC MFC - TOPAZ
Data source: UCL CryoSAT-2 sea ice thickness
Validation statistics summary
| Bias (m) | RMS (m) | total grids | low SIT | OK SIT | high SIT | |
|---|---|---|---|---|---|---|
| Best estimate | -0.94 | 1.09 | 41216 | 17182 | 23999 | 35 |
| Day 1 forecast | -0.93 | 1.08 | 41216 | 17009 | 24173 | 34 |
| Day 4 forecast | -0.93 | 1.09 | 41216 | 17032 | 24151 | 33 |
| Day 7 forecast | -0.92 | 1.07 | 41216 | 16624 | 24556 | 36 |
| Day 10 forecast | -0.93 | 1.08 | 41216 | 16816 | 24364 | 36 |
Numbers in the three rightmost columns are grid counts. Regions with high/low sea ice thickness correspond to areas with model offsets from the gridded observations outside of one standard deviation. (Standard deviations are provided in the observational product.)
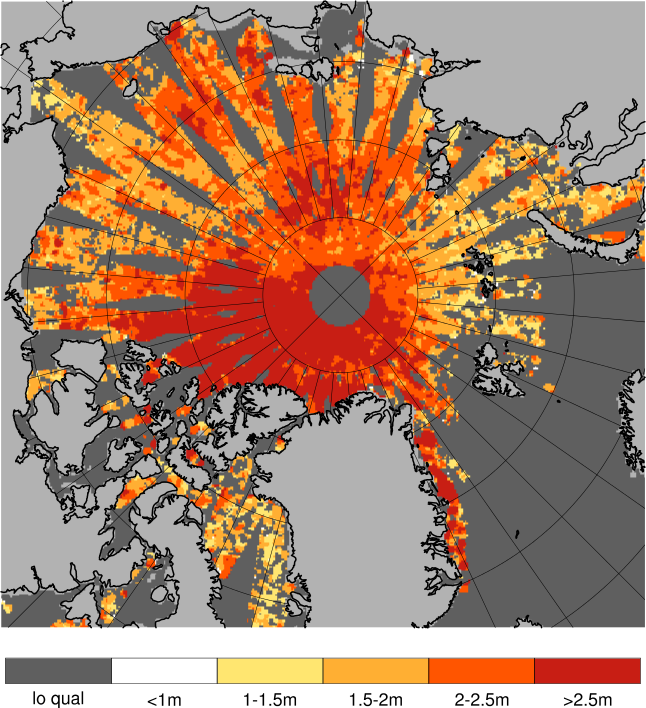
Definition of categories:
| Category | Sea ice thickness |
|---|---|
| c1 | <1m |
| c2 | 1 - 1.5m |
| c3 | 1.5 - 2m |
| c4 | 2 - 2.5m |
| c5 | 2.5 - 3m |
| c6 | >3m |
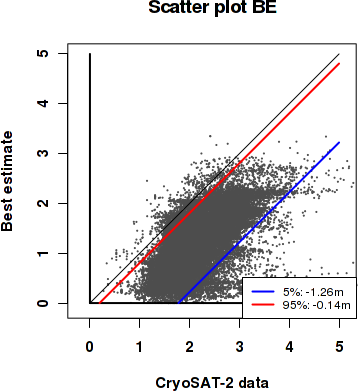
Best estimate vs. observations
Contingency table
| observations | |||||||||
|---|---|---|---|---|---|---|---|---|---|
| open | c1 | c2 | c3 | c4 | c5 | c6 | |||
| m o d e l |
open | 0 | 0 | 0 | 0 | 0 | 0 | 0 | |
| c1 | 0 | 0.003 | 0.077 | 0.163 | 0.065 | 0.016 | 0.012 | ||
| c2 | 0 | 0 | 0.005 | 0.093 | 0.135 | 0.046 | 0.004 | ||
| c3 | 0 | 0 | 0.002 | 0.066 | 0.115 | 0.071 | 0.038 | ||
| c4 | 0 | 0 | 0 | 0.003 | 0.013 | 0.031 | 0.03 | ||
| c5 | 0 | 0 | 0 | 0 | 0.001 | 0.003 | 0.006 | ||
| c6 | 0 | 0 | 0 | 0 | 0 | 0 | 0 | ||
See category definitions for details.
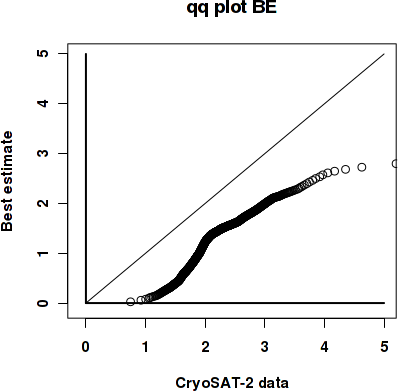
Statistical distribution
|
|
Observed sea ice thickness from CryoSAT
Sea ice thickness, best estimate product

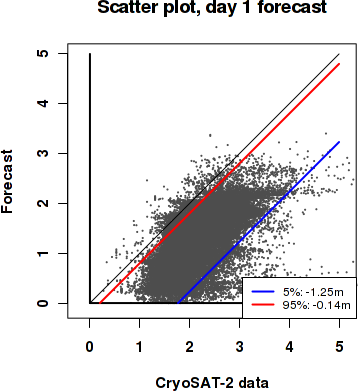
Day 1 forecast vs. observations
Contingency table
| observations | |||||||||
|---|---|---|---|---|---|---|---|---|---|
| open | c1 | c2 | c3 | c4 | c5 | c6 | |||
| m o d e l |
open | 0 | 0 | 0 | 0 | 0 | 0 | 0 | |
| c1 | 0 | 0.003 | 0.076 | 0.161 | 0.064 | 0.015 | 0.012 | ||
| c2 | 0 | 0 | 0.005 | 0.095 | 0.136 | 0.046 | 0.005 | ||
| c3 | 0 | 0 | 0.002 | 0.067 | 0.118 | 0.072 | 0.038 | ||
| c4 | 0 | 0 | 0 | 0.003 | 0.011 | 0.03 | 0.03 | ||
| c5 | 0 | 0 | 0 | 0 | 0.001 | 0.003 | 0.006 | ||
| c6 | 0 | 0 | 0 | 0 | 0 | 0 | 0 | ||
See category definitions for details.
Statistical distribution

|
|
Sea ice thickness, day 1 forecast

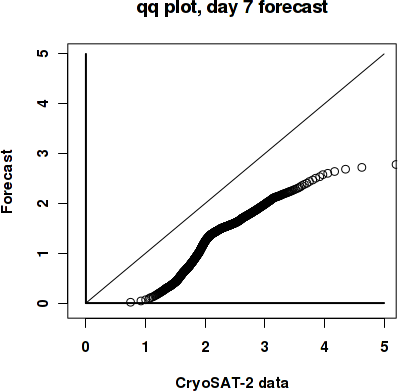
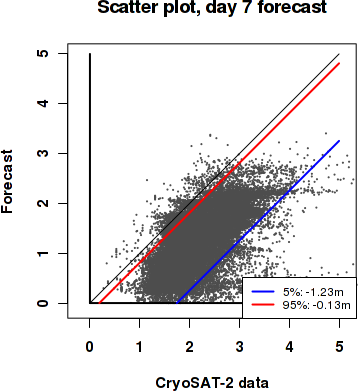
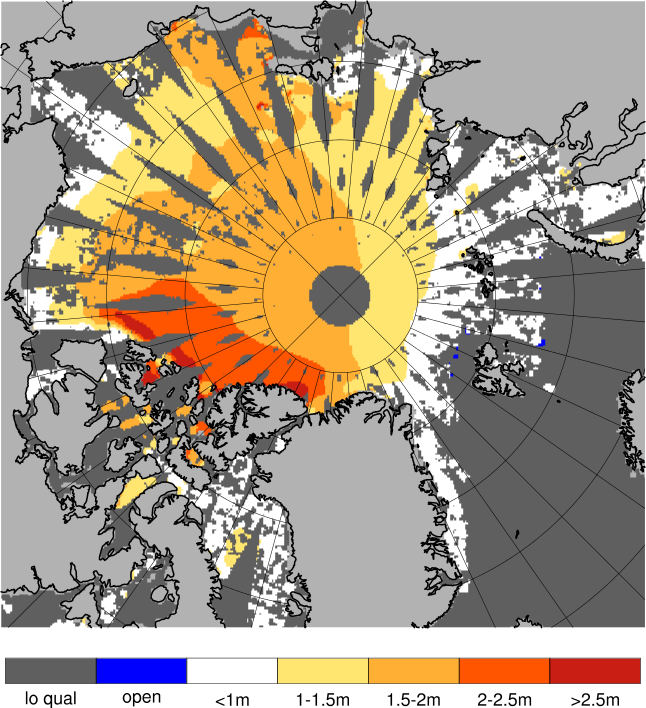
Day 7 forecast vs. observations
Contingency table
| observations | |||||||||
|---|---|---|---|---|---|---|---|---|---|
| open | c1 | c2 | c3 | c4 | c5 | c6 | |||
| m o d e l |
open | 0 | 0 | 0 | 0.001 | 0 | 0 | 0 | |
| c1 | 0 | 0.003 | 0.076 | 0.159 | 0.061 | 0.014 | 0.012 | ||
| c2 | 0 | 0 | 0.005 | 0.094 | 0.135 | 0.046 | 0.004 | ||
| c3 | 0 | 0 | 0.002 | 0.07 | 0.12 | 0.073 | 0.039 | ||
| c4 | 0 | 0 | 0 | 0.003 | 0.013 | 0.03 | 0.03 | ||
| c5 | 0 | 0 | 0 | 0 | 0.001 | 0.003 | 0.006 | ||
| c6 | 0 | 0 | 0 | 0 | 0 | 0 | 0 | ||
See category definitions for details.
Statistical distribution
|
|
Sea ice thickness, day 7 forecast
Generated by /metno/routine/sms/V2/SIthickness/c2iceWebPage.sh Fri Apr 27 03:53:16 UTC 2018 on arcmfcval