Validation of ice thickness - Full domain
Bulletin date: 2017-12-07
Model: ARC MFC - TOPAZ
Data source: UCL CryoSAT-2 sea ice thickness
Validation statistics summary
| Bias (m) | RMS (m) | total grids | low SIT | OK SIT | high SIT | |
|---|---|---|---|---|---|---|
| Best estimate | -0.97 | 1.07 | 33132 | 20417 | 12683 | 32 |
| Day 1 forecast | -0.97 | 1.07 | 33132 | 20432 | 12671 | 29 |
| Day 4 forecast | -0.97 | 1.07 | 33132 | 20632 | 12471 | 29 |
| Day 7 forecast | -0.95 | 1.06 | 33132 | 19855 | 13241 | 36 |
| Day 10 forecast | -0.97 | 1.07 | 33132 | 20458 | 12639 | 35 |
Numbers in the three rightmost columns are grid counts. Regions with high/low sea ice thickness correspond to areas with model offsets from the gridded observations outside of one standard deviation. (Standard deviations are provided in the observational product.)
Definition of categories:
| Category | Sea ice thickness |
|---|---|
| c1 | <1m |
| c2 | 1 - 1.5m |
| c3 | 1.5 - 2m |
| c4 | 2 - 2.5m |
| c5 | 2.5 - 3m |
| c6 | >3m |
Best estimate vs. observations
Contingency table
| observations | |||||||||
|---|---|---|---|---|---|---|---|---|---|
| open | c1 | c2 | c3 | c4 | c5 | c6 | |||
| m o d e l |
open | 0 | 0 | 0 | 0 | 0 | 0 | 0.001 | |
| c1 | 0 | 0.044 | 0.285 | 0.266 | 0.109 | 0.012 | 0.007 | ||
| c2 | 0 | 0.001 | 0.012 | 0.038 | 0.079 | 0.019 | 0.005 | ||
| c3 | 0 | 0 | 0.001 | 0.007 | 0.041 | 0.042 | 0.014 | ||
| c4 | 0 | 0 | 0.001 | 0.002 | 0.007 | 0.004 | 0.002 | ||
| c5 | 0 | 0 | 0 | 0 | 0 | 0 | 0 | ||
| c6 | 0 | 0 | 0 | 0 | 0 | 0 | 0 | ||
See category definitions for details.
Statistical distribution
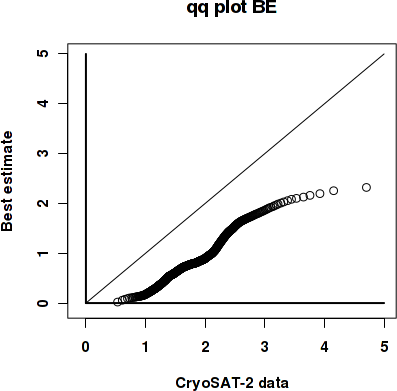
|
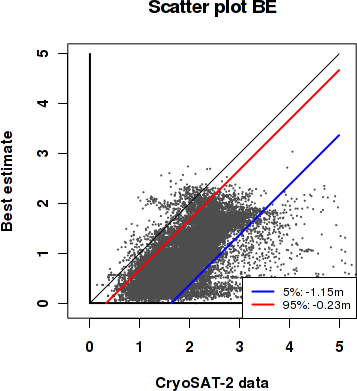
|
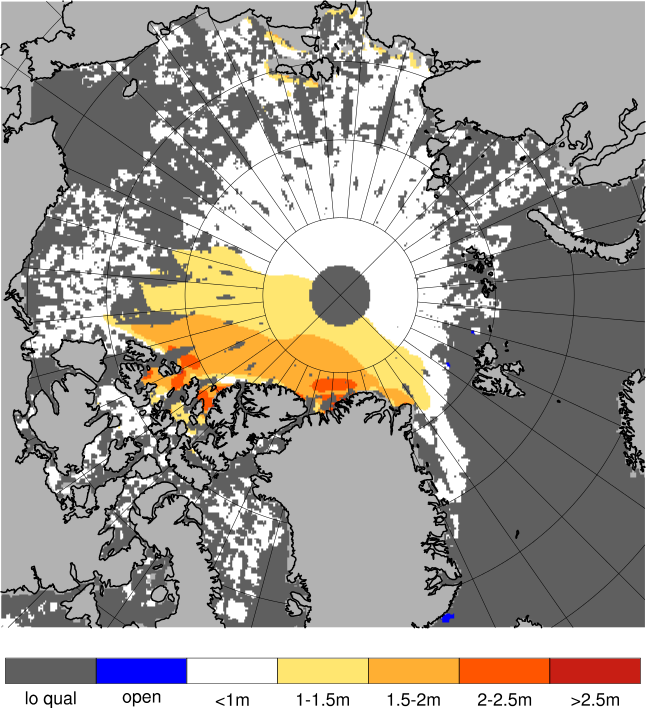
Observed sea ice thickness from CryoSAT
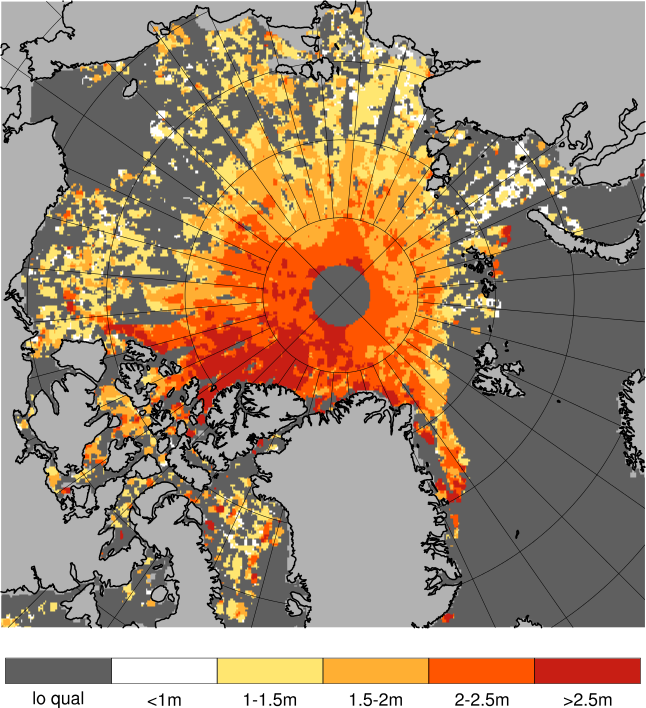
Sea ice thickness, best estimate product

Day 1 forecast vs. observations
Contingency table
| observations | |||||||||
|---|---|---|---|---|---|---|---|---|---|
| open | c1 | c2 | c3 | c4 | c5 | c6 | |||
| m o d e l |
open | 0 | 0 | 0 | 0 | 0 | 0 | 0.001 | |
| c1 | 0 | 0.044 | 0.285 | 0.266 | 0.111 | 0.013 | 0.006 | ||
| c2 | 0 | 0.001 | 0.012 | 0.04 | 0.078 | 0.02 | 0.005 | ||
| c3 | 0 | 0 | 0.001 | 0.007 | 0.04 | 0.041 | 0.015 | ||
| c4 | 0 | 0 | 0 | 0.002 | 0.006 | 0.004 | 0.002 | ||
| c5 | 0 | 0 | 0 | 0 | 0 | 0 | 0 | ||
| c6 | 0 | 0 | 0 | 0 | 0 | 0 | 0 | ||
See category definitions for details.
Statistical distribution

|
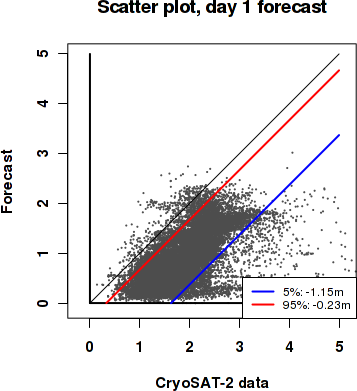
|
Sea ice thickness, day 1 forecast
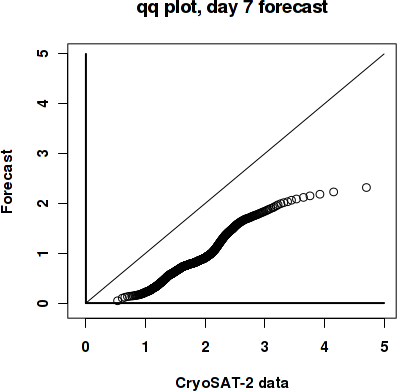
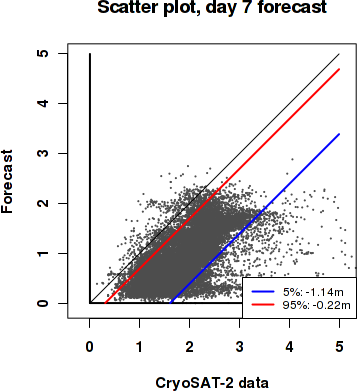
Day 7 forecast vs. observations
Contingency table
| observations | |||||||||
|---|---|---|---|---|---|---|---|---|---|
| open | c1 | c2 | c3 | c4 | c5 | c6 | |||
| m o d e l |
open | 0 | 0 | 0 | 0 | 0 | 0 | 0.001 | |
| c1 | 0 | 0.044 | 0.283 | 0.265 | 0.108 | 0.012 | 0.006 | ||
| c2 | 0 | 0.001 | 0.013 | 0.04 | 0.082 | 0.02 | 0.005 | ||
| c3 | 0 | 0 | 0.001 | 0.008 | 0.04 | 0.042 | 0.015 | ||
| c4 | 0 | 0 | 0 | 0.002 | 0.006 | 0.003 | 0.002 | ||
| c5 | 0 | 0 | 0 | 0 | 0 | 0 | 0 | ||
| c6 | 0 | 0 | 0 | 0 | 0 | 0 | 0 | ||
See category definitions for details.
Statistical distribution
|
|
Sea ice thickness, day 7 forecast

Generated by /metno/routine/sms/V2/SIthickness/c2iceWebPage.sh Fri Dec 22 03:53:00 UTC 2017 on arcmfcval