Validation of ice thickness - Full domain
Bulletin date: 2017-10-19
Model: ARC MFC - TOPAZ
Data source: UCL CryoSAT-2 sea ice thickness
Validation statistics summary
| Bias (m) | RMS (m) | total grids | low SIT | OK SIT | high SIT | |
|---|---|---|---|---|---|---|
| Best estimate | -0.8 | 0.91 | 20121 | 10947 | 9117 | 57 |
| Day 1 forecast | -0.8 | 0.92 | 20121 | 10974 | 9088 | 59 |
| Day 4 forecast | -0.8 | 0.92 | 20121 | 11016 | 9042 | 63 |
| Day 7 forecast | -0.79 | 0.91 | 20121 | 10704 | 9356 | 61 |
| Day 10 forecast | -0.81 | 0.92 | 20121 | 11085 | 8985 | 51 |
Numbers in the three rightmost columns are grid counts. Regions with high/low sea ice thickness correspond to areas with model offsets from the gridded observations outside of one standard deviation. (Standard deviations are provided in the observational product.)
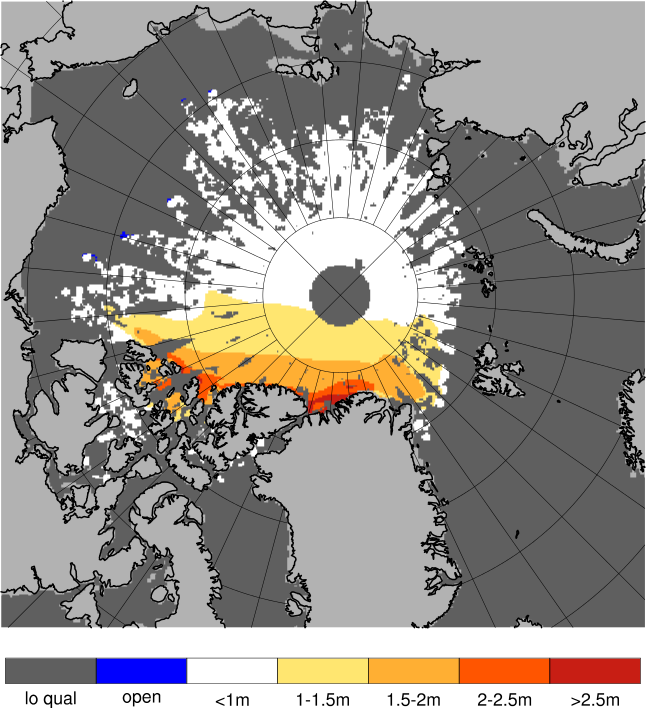
Definition of categories:
| Category | Sea ice thickness |
|---|---|
| c1 | <1m |
| c2 | 1 - 1.5m |
| c3 | 1.5 - 2m |
| c4 | 2 - 2.5m |
| c5 | 2.5 - 3m |
| c6 | >3m |
Best estimate vs. observations
Contingency table
| observations | |||||||||
|---|---|---|---|---|---|---|---|---|---|
| open | c1 | c2 | c3 | c4 | c5 | c6 | |||
| m o d e l |
open | 0 | 0 | 0.002 | 0 | 0 | 0 | 0 | |
| c1 | 0 | 0.052 | 0.259 | 0.265 | 0.068 | 0.001 | 0.001 | ||
| c2 | 0 | 0.001 | 0.028 | 0.096 | 0.072 | 0.002 | 0.001 | ||
| c3 | 0 | 0 | 0.009 | 0.032 | 0.063 | 0.011 | 0.001 | ||
| c4 | 0 | 0 | 0.002 | 0.005 | 0.011 | 0.008 | 0.003 | ||
| c5 | 0 | 0 | 0 | 0.001 | 0.002 | 0.001 | 0.002 | ||
| c6 | 0 | 0 | 0 | 0 | 0 | 0 | 0 | ||
See category definitions for details.
Statistical distribution
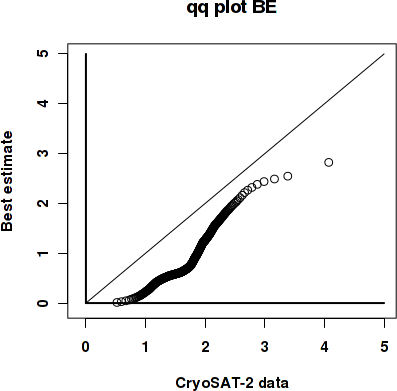
|
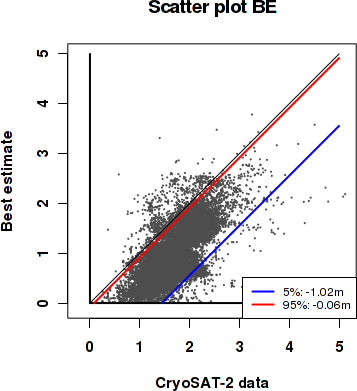
|
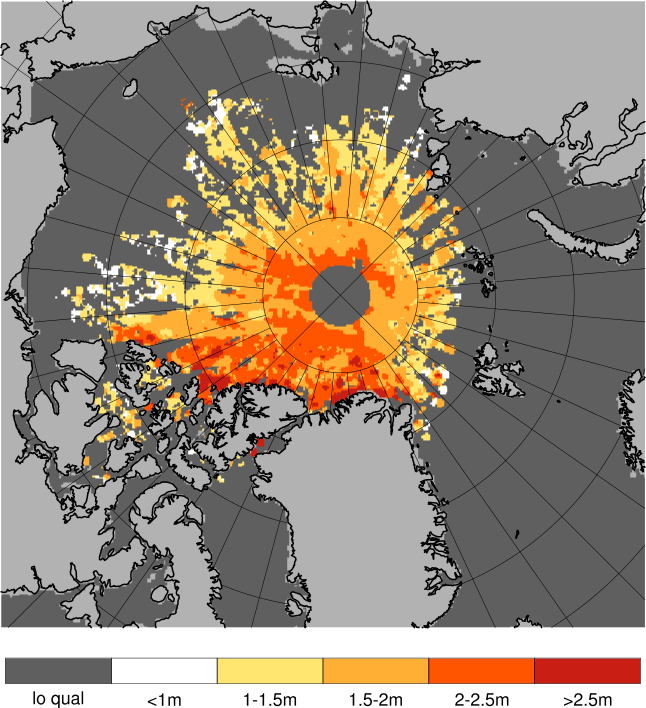
Observed sea ice thickness from CryoSAT
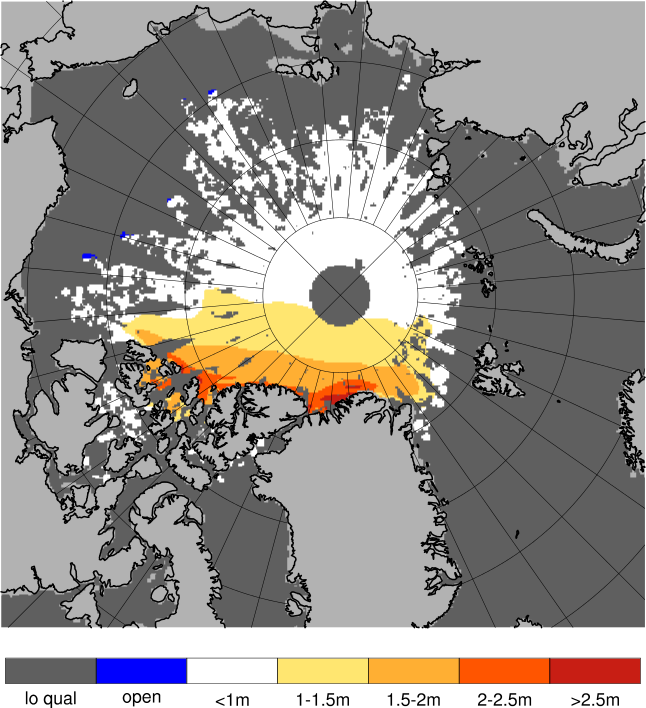
Sea ice thickness, best estimate product
Day 1 forecast vs. observations
Contingency table
| observations | |||||||||
|---|---|---|---|---|---|---|---|---|---|
| open | c1 | c2 | c3 | c4 | c5 | c6 | |||
| m o d e l |
open | 0 | 0 | 0.001 | 0 | 0 | 0 | 0 | |
| c1 | 0 | 0.051 | 0.255 | 0.265 | 0.068 | 0.001 | 0.001 | ||
| c2 | 0 | 0.003 | 0.031 | 0.093 | 0.077 | 0.004 | 0.001 | ||
| c3 | 0 | 0 | 0.01 | 0.036 | 0.06 | 0.011 | 0.002 | ||
| c4 | 0 | 0 | 0.001 | 0.004 | 0.009 | 0.007 | 0.002 | ||
| c5 | 0 | 0 | 0 | 0.001 | 0.003 | 0.001 | 0.002 | ||
| c6 | 0 | 0 | 0 | 0 | 0 | 0 | 0 | ||
See category definitions for details.
Statistical distribution
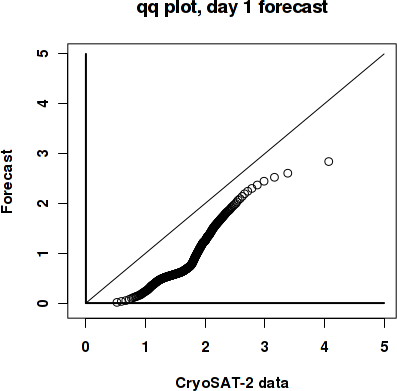
|
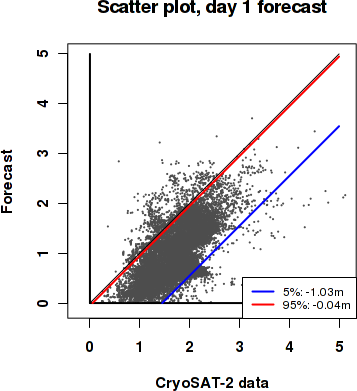
|
Sea ice thickness, day 1 forecast
Day 7 forecast vs. observations
Contingency table
| observations | |||||||||
|---|---|---|---|---|---|---|---|---|---|
| open | c1 | c2 | c3 | c4 | c5 | c6 | |||
| m o d e l |
open | 0 | 0 | 0.001 | 0 | 0 | 0 | 0 | |
| c1 | 0 | 0.051 | 0.255 | 0.262 | 0.068 | 0.001 | 0.001 | ||
| c2 | 0 | 0.003 | 0.031 | 0.096 | 0.076 | 0.003 | 0.001 | ||
| c3 | 0 | 0 | 0.01 | 0.037 | 0.061 | 0.012 | 0.002 | ||
| c4 | 0 | 0 | 0.001 | 0.004 | 0.009 | 0.007 | 0.002 | ||
| c5 | 0 | 0 | 0 | 0.001 | 0.002 | 0.001 | 0.002 | ||
| c6 | 0 | 0 | 0 | 0 | 0 | 0 | 0 | ||
See category definitions for details.
Statistical distribution

|
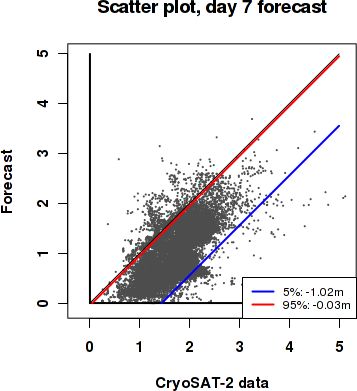
|
Sea ice thickness, day 7 forecast

Generated by /metno/routine/sms/V2/SIthickness/c2iceWebPage.sh Fri Nov 3 03:52:39 UTC 2017 on arcmfcval