Validation of ice thickness - Full domain
Bulletin date: 2017-10-12
Model: ARC MFC - TOPAZ
Data source: UCL CryoSAT-2 sea ice thickness
Validation statistics summary
| Bias (m) | RMS (m) | total grids | low SIT | OK SIT | high SIT | |
|---|---|---|---|---|---|---|
| Best estimate | -0.8 | 0.92 | 17124 | 9076 | 7989 | 59 |
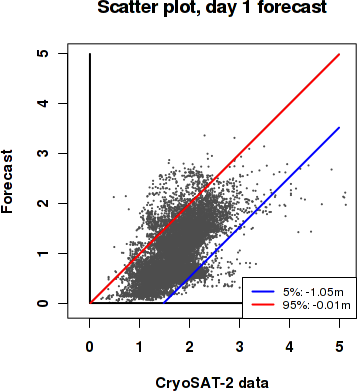
| Day 1 forecast | -0.81 | 0.93 | 17124 | 9275 | 7791 | 58 |
| Day 4 forecast | -0.81 | 0.93 | 17124 | 9301 | 7766 | 57 |
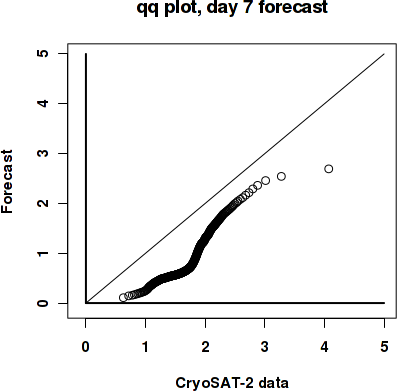
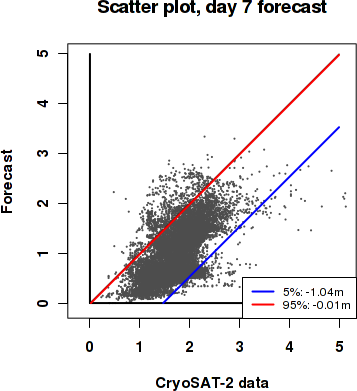
| Day 7 forecast | -0.8 | 0.93 | 17124 | 9155 | 7909 | 60 |
| Day 10 forecast | -0.81 | 0.94 | 17124 | 9279 | 7791 | 54 |
Numbers in the three rightmost columns are grid counts. Regions with high/low sea ice thickness correspond to areas with model offsets from the gridded observations outside of one standard deviation. (Standard deviations are provided in the observational product.)
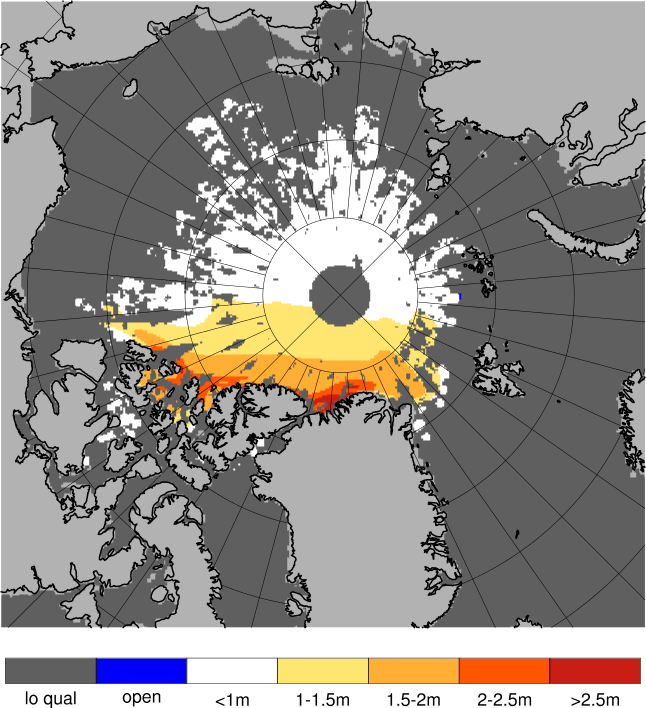
Definition of categories:
| Category | Sea ice thickness |
|---|---|
| c1 | <1m |
| c2 | 1 - 1.5m |
| c3 | 1.5 - 2m |
| c4 | 2 - 2.5m |
| c5 | 2.5 - 3m |
| c6 | >3m |
Best estimate vs. observations
Contingency table
| observations | |||||||||
|---|---|---|---|---|---|---|---|---|---|
| open | c1 | c2 | c3 | c4 | c5 | c6 | |||
| m o d e l |
open | 0 | 0 | 0 | 0 | 0 | 0 | 0 | |
| c1 | 0 | 0.033 | 0.222 | 0.283 | 0.066 | 0.003 | 0.002 | ||
| c2 | 0 | 0.002 | 0.03 | 0.106 | 0.077 | 0.003 | 0 | ||
| c3 | 0 | 0 | 0.013 | 0.04 | 0.067 | 0.013 | 0.002 | ||
| c4 | 0 | 0 | 0.002 | 0.006 | 0.014 | 0.006 | 0.003 | ||
| c5 | 0 | 0 | 0 | 0.001 | 0.003 | 0.001 | 0.001 | ||
| c6 | 0 | 0 | 0 | 0 | 0 | 0 | 0 | ||
See category definitions for details.
Statistical distribution
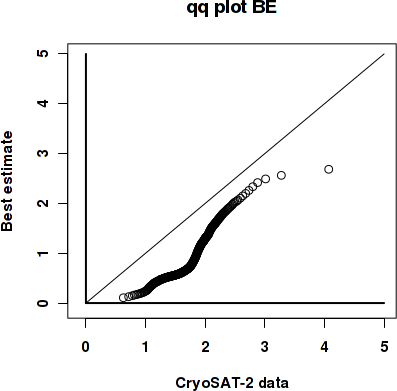
|
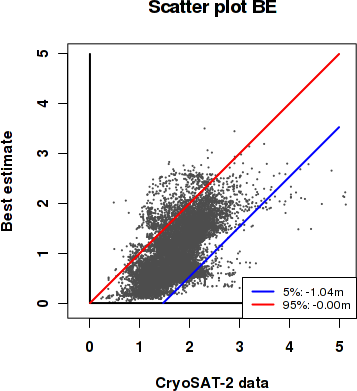
|
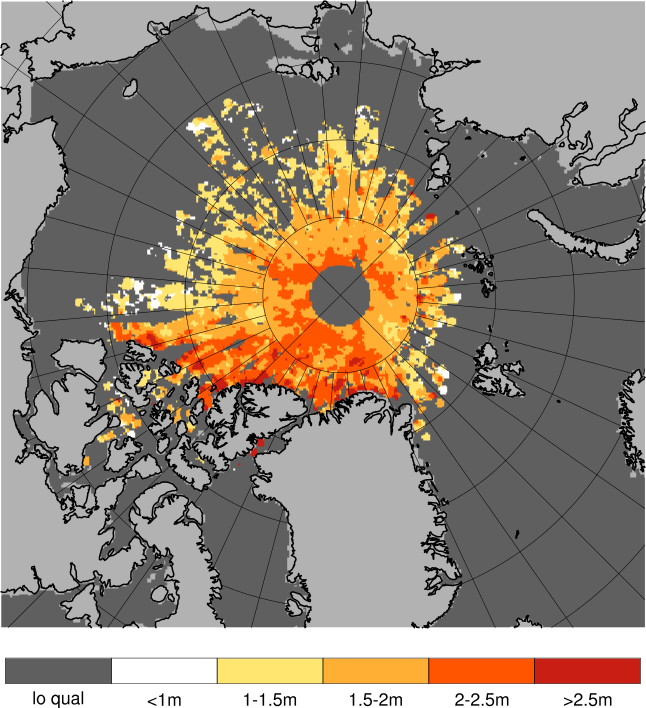
Observed sea ice thickness from CryoSAT
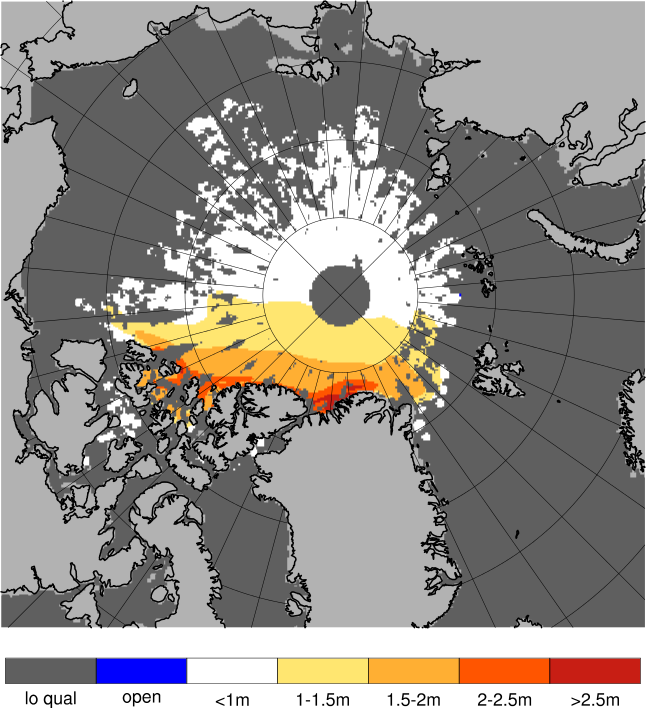
Sea ice thickness, best estimate product
Day 1 forecast vs. observations
Contingency table
| observations | |||||||||
|---|---|---|---|---|---|---|---|---|---|
| open | c1 | c2 | c3 | c4 | c5 | c6 | |||
| m o d e l |
open | 0 | 0 | 0 | 0 | 0 | 0 | 0 | |
| c1 | 0 | 0.033 | 0.223 | 0.287 | 0.067 | 0.003 | 0.002 | ||
| c2 | 0 | 0.002 | 0.029 | 0.101 | 0.081 | 0.004 | 0 | ||
| c3 | 0 | 0 | 0.012 | 0.041 | 0.064 | 0.013 | 0.002 | ||
| c4 | 0 | 0 | 0.002 | 0.005 | 0.012 | 0.006 | 0.002 | ||
| c5 | 0 | 0 | 0 | 0.002 | 0.003 | 0 | 0.001 | ||
| c6 | 0 | 0 | 0 | 0 | 0 | 0 | 0 | ||
See category definitions for details.
Statistical distribution

|
|
Sea ice thickness, day 1 forecast
Day 7 forecast vs. observations
Contingency table
| observations | |||||||||
|---|---|---|---|---|---|---|---|---|---|
| open | c1 | c2 | c3 | c4 | c5 | c6 | |||
| m o d e l |
open | 0 | 0 | 0 | 0 | 0 | 0 | 0 | |
| c1 | 0 | 0.033 | 0.223 | 0.285 | 0.066 | 0.003 | 0.002 | ||
| c2 | 0 | 0.002 | 0.03 | 0.103 | 0.08 | 0.003 | 0 | ||
| c3 | 0 | 0 | 0.012 | 0.042 | 0.065 | 0.014 | 0.003 | ||
| c4 | 0 | 0 | 0.002 | 0.005 | 0.012 | 0.006 | 0.002 | ||
| c5 | 0 | 0 | 0 | 0.001 | 0.003 | 0 | 0.001 | ||
| c6 | 0 | 0 | 0 | 0 | 0 | 0 | 0 | ||
See category definitions for details.
Statistical distribution
|
|
Sea ice thickness, day 7 forecast

Generated by /metno/routine/sms/V2/SIthickness/c2iceWebPage.sh Fri Oct 27 03:52:50 UTC 2017 on arcmfcval