Validation of ice thickness - Full domain
Bulletin date: 2017-02-02
Model: ARC MFC - TOPAZ
Data source: UCL CryoSAT-2 sea ice thickness
Validation statistics summary
| Bias (m) | RMS (m) | total grids | low SIT | OK SIT | high SIT | |
|---|---|---|---|---|---|---|
| Best estimate | -0.81 | 0.98 | 42006 | 17313 | 24595 | 98 |
| Day 1 forecast | -0.82 | 0.98 | 42006 | 17509 | 24404 | 93 |
| Day 4 forecast | -0.82 | 0.99 | 42006 | 17781 | 24127 | 98 |
| Day 7 forecast | -0.81 | 0.98 | 42006 | 17049 | 24865 | 92 |
| Day 10 forecast | -0.83 | 1 | 42006 | 17695 | 24238 | 73 |
Numbers in the three rightmost columns are grid counts. Regions with high/low sea ice thickness correspond to areas with model offsets from the gridded observations outside of one standard deviation. (Standard deviations are provided in the observational product.)
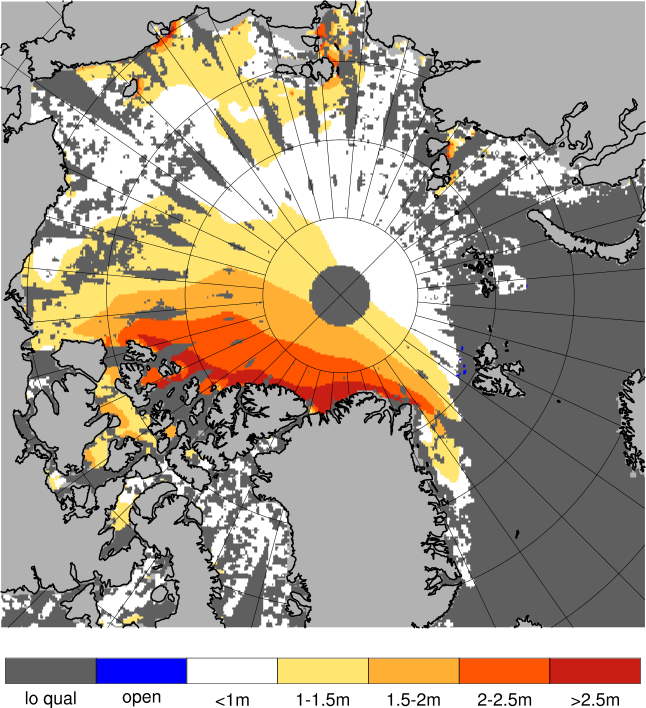
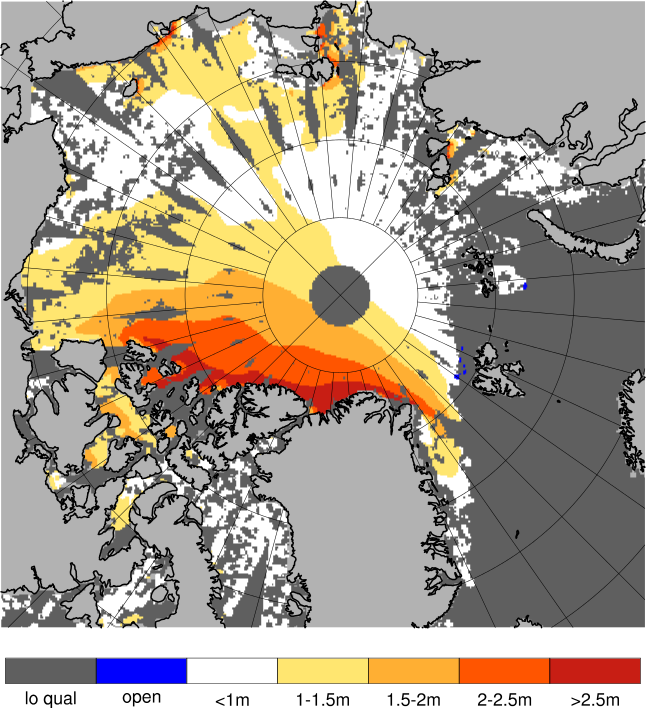
Definition of categories:
| Category | Sea ice thickness |
|---|---|
| c1 | <1m |
| c2 | 1 - 1.5m |
| c3 | 1.5 - 2m |
| c4 | 2 - 2.5m |
| c5 | 2.5 - 3m |
| c6 | >3m |
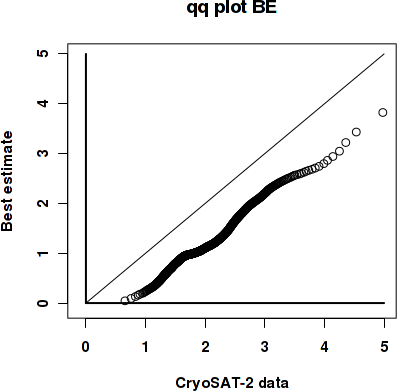
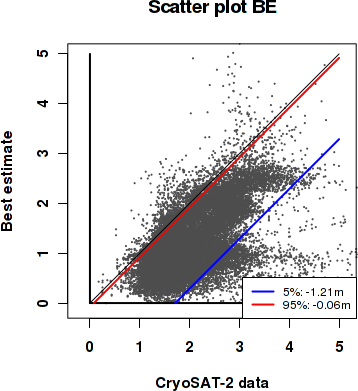
Best estimate vs. observations
Contingency table
| observations | |||||||||
|---|---|---|---|---|---|---|---|---|---|
| open | c1 | c2 | c3 | c4 | c5 | c6 | |||
| m o d e l |
open | 0 | 0 | 0 | 0 | 0 | 0 | 0 | |
| c1 | 0 | 0.01 | 0.179 | 0.203 | 0.081 | 0.024 | 0.012 | ||
| c2 | 0 | 0.001 | 0.057 | 0.135 | 0.061 | 0.019 | 0.005 | ||
| c3 | 0 | 0 | 0.004 | 0.029 | 0.032 | 0.034 | 0.01 | ||
| c4 | 0 | 0 | 0 | 0.004 | 0.021 | 0.032 | 0.021 | ||
| c5 | 0 | 0 | 0 | 0.001 | 0.001 | 0.005 | 0.015 | ||
| c6 | 0 | 0 | 0 | 0 | 0 | 0.001 | 0.004 | ||
See category definitions for details.
Statistical distribution
|
|
Observed sea ice thickness from CryoSAT

Sea ice thickness, best estimate product
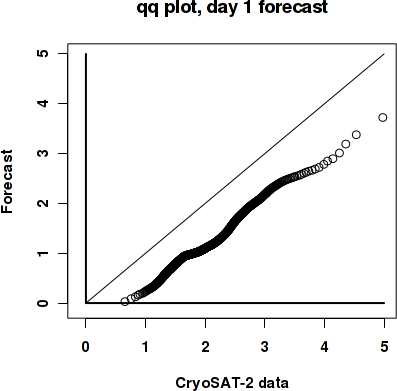
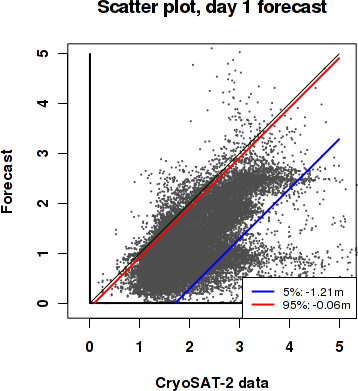
Day 1 forecast vs. observations
Contingency table
| observations | |||||||||
|---|---|---|---|---|---|---|---|---|---|
| open | c1 | c2 | c3 | c4 | c5 | c6 | |||
| m o d e l |
open | 0 | 0 | 0 | 0 | 0 | 0 | 0 | |
| c1 | 0 | 0.01 | 0.176 | 0.205 | 0.083 | 0.025 | 0.012 | ||
| c2 | 0 | 0.001 | 0.06 | 0.134 | 0.059 | 0.018 | 0.005 | ||
| c3 | 0 | 0 | 0.003 | 0.028 | 0.035 | 0.035 | 0.011 | ||
| c4 | 0 | 0 | 0.001 | 0.004 | 0.019 | 0.031 | 0.021 | ||
| c5 | 0 | 0 | 0 | 0 | 0.001 | 0.004 | 0.014 | ||
| c6 | 0 | 0 | 0 | 0 | 0 | 0.001 | 0.003 | ||
See category definitions for details.
Statistical distribution
|
|
Sea ice thickness, day 1 forecast

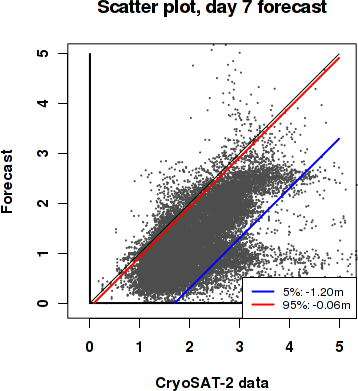
Day 7 forecast vs. observations
Contingency table
| observations | |||||||||
|---|---|---|---|---|---|---|---|---|---|
| open | c1 | c2 | c3 | c4 | c5 | c6 | |||
| m o d e l |
open | 0 | 0 | 0 | 0 | 0 | 0 | 0 | |
| c1 | 0 | 0.009 | 0.168 | 0.187 | 0.079 | 0.023 | 0.013 | ||
| c2 | 0 | 0.001 | 0.068 | 0.151 | 0.062 | 0.02 | 0.005 | ||
| c3 | 0 | 0 | 0.003 | 0.029 | 0.035 | 0.035 | 0.01 | ||
| c4 | 0 | 0 | 0.001 | 0.004 | 0.019 | 0.031 | 0.02 | ||
| c5 | 0 | 0 | 0 | 0.001 | 0.001 | 0.004 | 0.015 | ||
| c6 | 0 | 0 | 0 | 0 | 0 | 0.001 | 0.004 | ||
See category definitions for details.
Statistical distribution

|
|
Sea ice thickness, day 7 forecast
Generated by /metno/routine/sms/V2/SIthickness/c2iceWebPage.sh on. 25. okt. 12:20:27 +0000 2017 on arcmfcval