Validation of ice thickness - Full domain
Bulletin date: 2017-01-12
Model: ARC MFC - TOPAZ
Data source: UCL CryoSAT-2 sea ice thickness
Validation statistics summary
| Bias (m) | RMS (m) | total grids | low SIT | OK SIT | high SIT | |
|---|---|---|---|---|---|---|
| Best estimate | -0.92 | 1.11 | 39600 | 19242 | 20314 | 44 |
| Day 1 forecast | -0.92 | 1.12 | 39600 | 19397 | 20162 | 41 |
| Day 4 forecast | -0.95 | 1.14 | 39600 | 20450 | 19109 | 41 |
| Day 7 forecast | -0.93 | 1.12 | 39600 | 19662 | 19871 | 67 |
| Day 10 forecast | -0.93 | 1.13 | 39600 | 19892 | 19667 | 41 |
Numbers in the three rightmost columns are grid counts. Regions with high/low sea ice thickness correspond to areas with model offsets from the gridded observations outside of one standard deviation. (Standard deviations are provided in the observational product.)
Definition of categories:
| Category | Sea ice thickness |
|---|---|
| c1 | <1m |
| c2 | 1 - 1.5m |
| c3 | 1.5 - 2m |
| c4 | 2 - 2.5m |
| c5 | 2.5 - 3m |
| c6 | >3m |
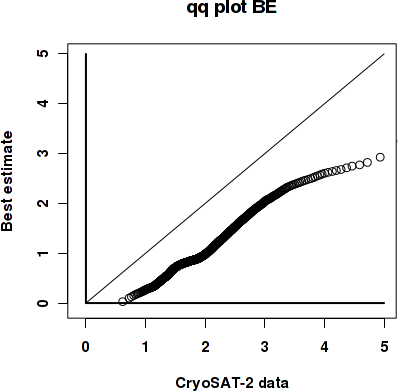
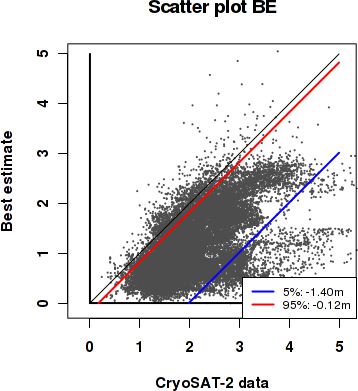
Best estimate vs. observations
Contingency table
| observations | |||||||||
|---|---|---|---|---|---|---|---|---|---|
| open | c1 | c2 | c3 | c4 | c5 | c6 | |||
| m o d e l |
open | 0 | 0 | 0 | 0 | 0 | 0 | 0.001 | |
| c1 | 0 | 0.02 | 0.224 | 0.252 | 0.096 | 0.028 | 0.019 | ||
| c2 | 0 | 0 | 0.022 | 0.077 | 0.037 | 0.017 | 0.01 | ||
| c3 | 0 | 0 | 0.004 | 0.024 | 0.033 | 0.04 | 0.013 | ||
| c4 | 0 | 0 | 0 | 0.003 | 0.015 | 0.024 | 0.019 | ||
| c5 | 0 | 0 | 0 | 0 | 0.001 | 0.003 | 0.014 | ||
| c6 | 0 | 0 | 0 | 0 | 0 | 0 | 0.001 | ||
See category definitions for details.
Statistical distribution
|
|
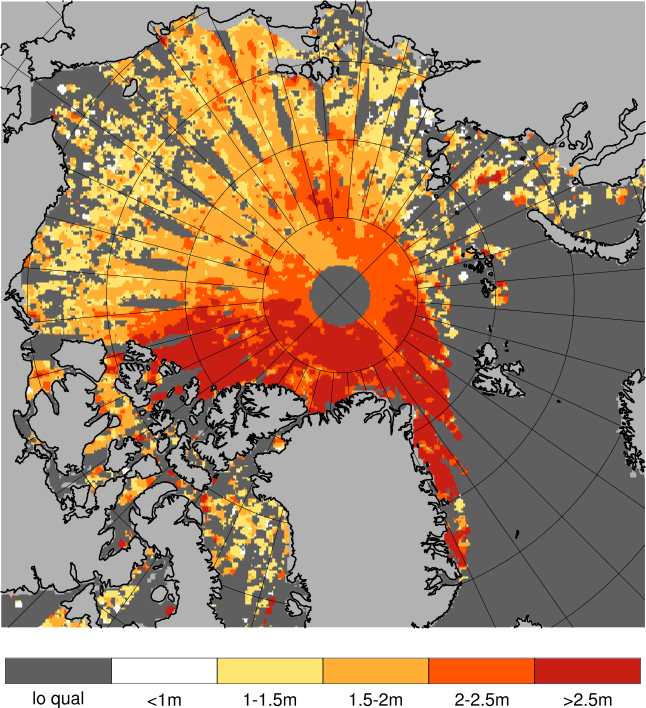
Observed sea ice thickness from CryoSAT
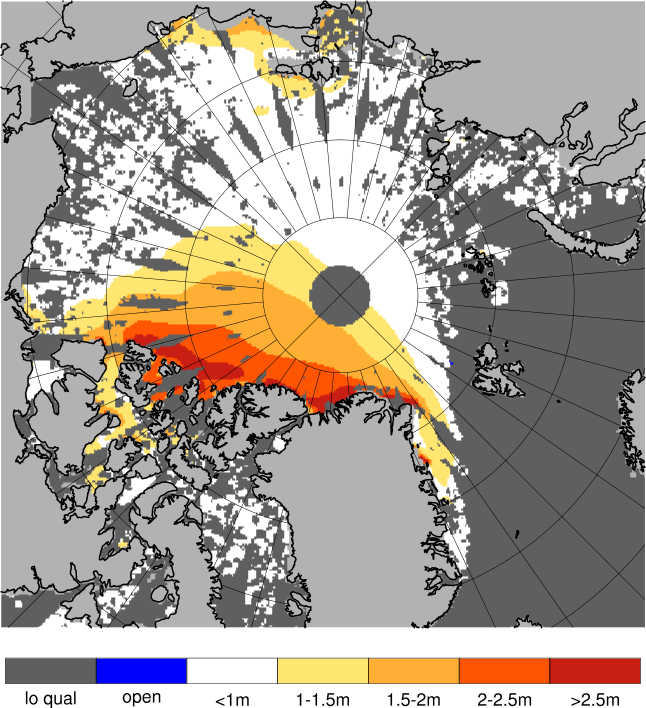
Sea ice thickness, best estimate product

Day 1 forecast vs. observations
Contingency table
| observations | |||||||||
|---|---|---|---|---|---|---|---|---|---|
| open | c1 | c2 | c3 | c4 | c5 | c6 | |||
| m o d e l |
open | 0 | 0 | 0 | 0 | 0 | 0 | 0.001 | |
| c1 | 0 | 0.02 | 0.224 | 0.254 | 0.096 | 0.027 | 0.019 | ||
| c2 | 0 | 0 | 0.022 | 0.076 | 0.037 | 0.017 | 0.01 | ||
| c3 | 0 | 0 | 0.004 | 0.024 | 0.033 | 0.042 | 0.013 | ||
| c4 | 0 | 0 | 0 | 0.003 | 0.014 | 0.022 | 0.02 | ||
| c5 | 0 | 0 | 0 | 0 | 0.002 | 0.004 | 0.014 | ||
| c6 | 0 | 0 | 0 | 0 | 0 | 0 | 0.001 | ||
See category definitions for details.
Statistical distribution

|

|
Sea ice thickness, day 1 forecast
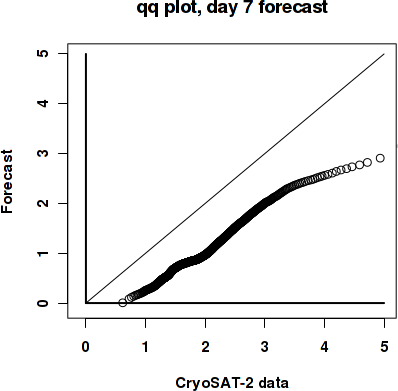
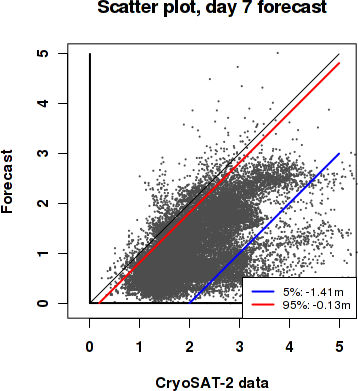
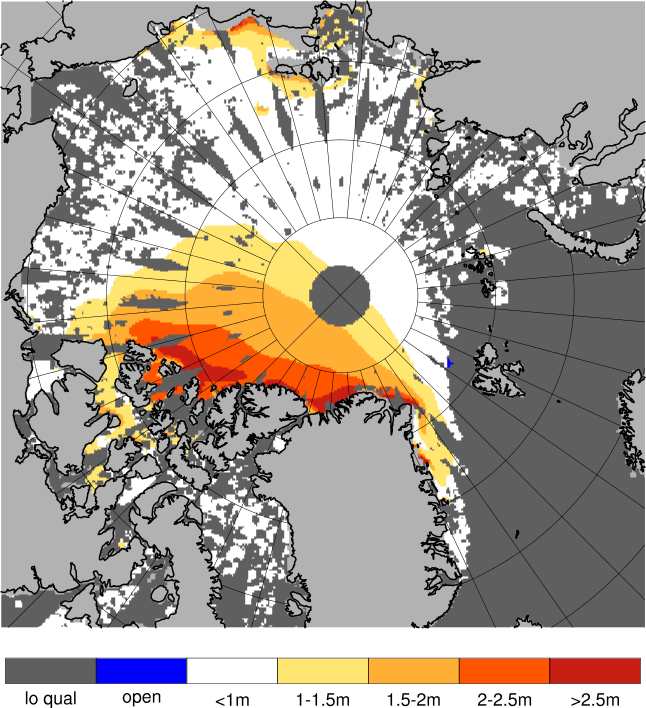
Day 7 forecast vs. observations
Contingency table
| observations | |||||||||
|---|---|---|---|---|---|---|---|---|---|
| open | c1 | c2 | c3 | c4 | c5 | c6 | |||
| m o d e l |
open | 0 | 0 | 0 | 0 | 0 | 0 | 0.001 | |
| c1 | 0 | 0.02 | 0.226 | 0.256 | 0.096 | 0.029 | 0.019 | ||
| c2 | 0 | 0.001 | 0.02 | 0.075 | 0.038 | 0.017 | 0.009 | ||
| c3 | 0 | 0 | 0.004 | 0.023 | 0.032 | 0.042 | 0.015 | ||
| c4 | 0 | 0 | 0.001 | 0.003 | 0.014 | 0.021 | 0.02 | ||
| c5 | 0 | 0 | 0 | 0 | 0.001 | 0.003 | 0.013 | ||
| c6 | 0 | 0 | 0 | 0 | 0 | 0 | 0.001 | ||
See category definitions for details.
Statistical distribution
|
|
Sea ice thickness, day 7 forecast
Generated by /metno/routine/sms/V2/SIthickness/c2iceWebPage.sh on. 25. okt. 12:17:02 +0000 2017 on arcmfcval