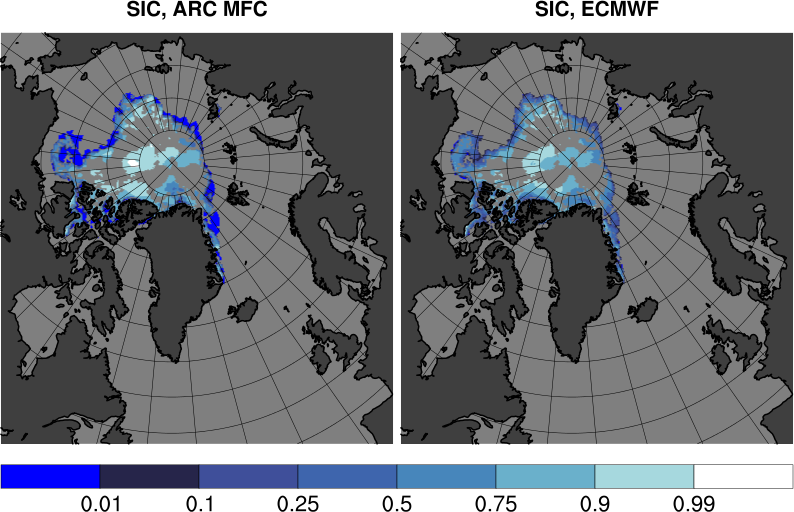
Monitoring results for sea ice concentration
Bulletin date: 2020-09-03
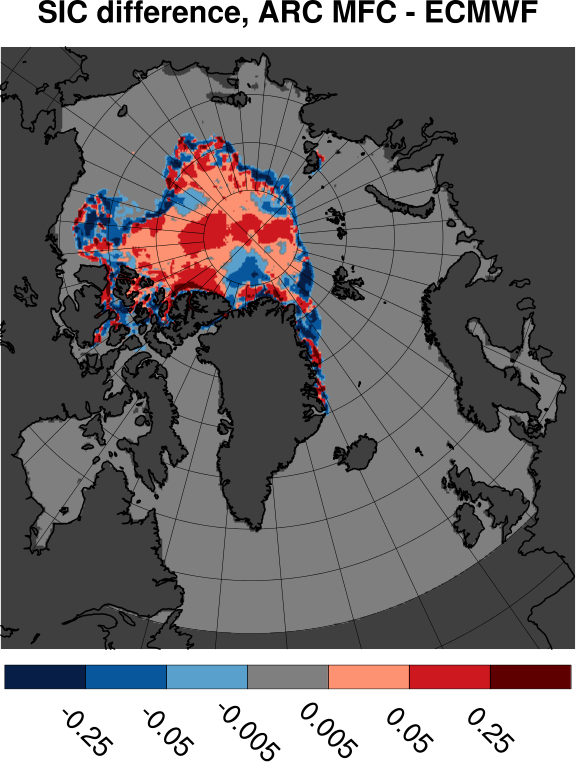
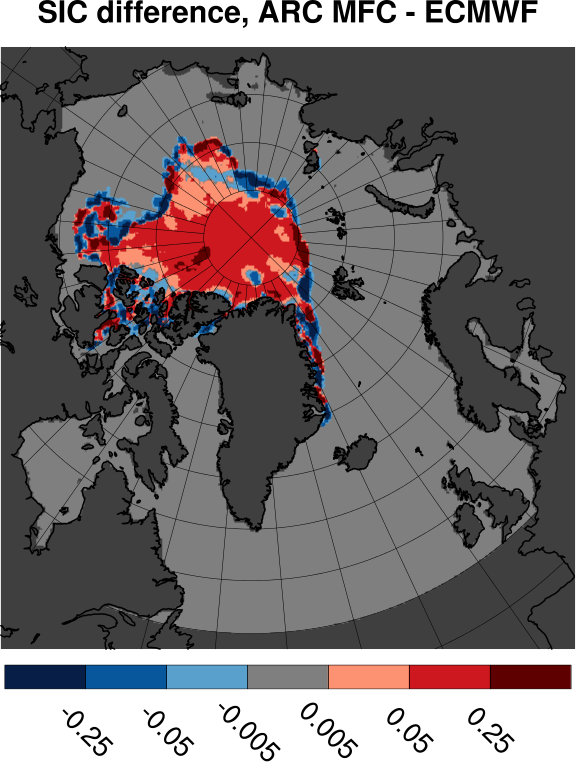
Areas from SIC differences categories
| Forecast lead time | ||||
|---|---|---|---|---|
| dSIC | +00h | +24h | +120h | +216h |
| < -0.25 | 0.30 | 0.30 | 0.36 | 0.27 |
| -0.25 - -0.05 | 0.69 | 0.64 | 0.59 | 0.46 |
| -0.05 - -0.005 | 0.58 | 0.65 | 0.55 | 0.43 |
| 0.005 - 0.05 | 1.25 | 1.24 | 0.89 | 0.72 |
| 0.05 - 0.25 | 1.05 | 0.88 | 1.35 | 1.85 |
| > 0.25 | 0.16 | 0.19 | 0.21 | 0.33 |
| dSIA | -0.02 | -0.02 | 0.02 | 0.20 |
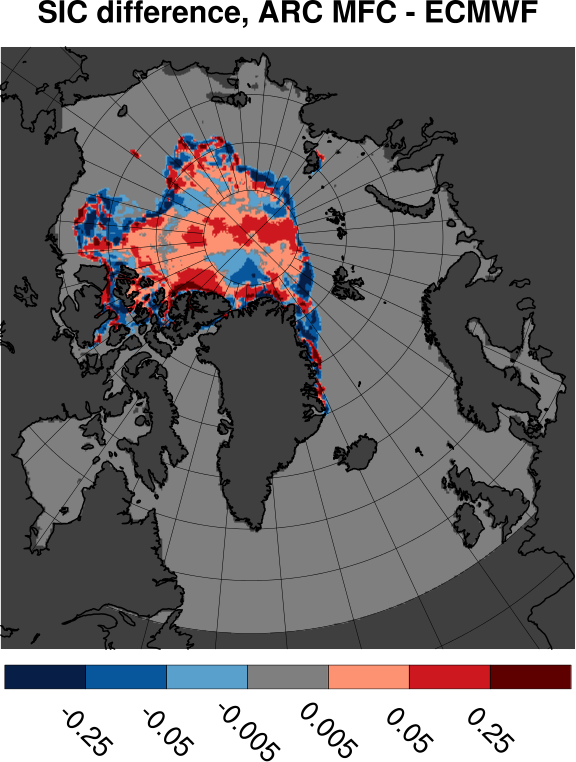
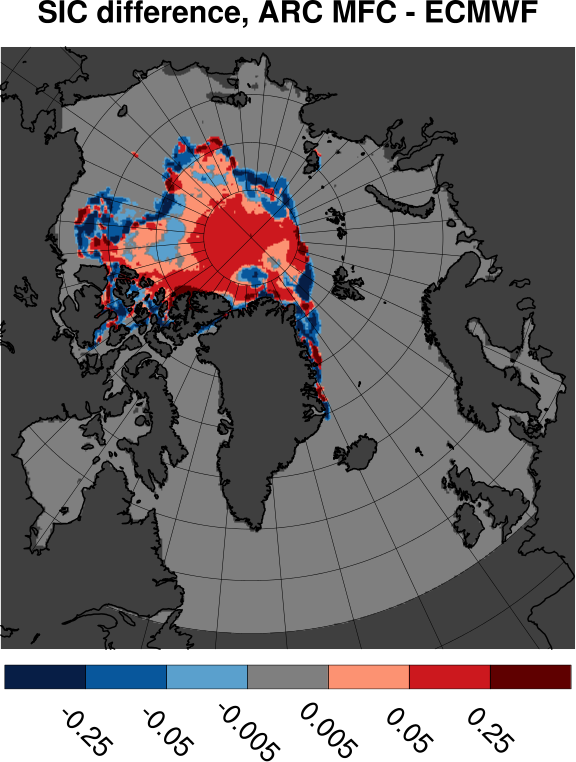
Tabulated values are computed by subtracting ECMWF results from ARC MFC results. All values are in units of Mkm2. Bottom row shows results for differences in sea ice area. Other rows shows area where the sea ice concentration differences fall inside the range given by the span in the leftmost column.
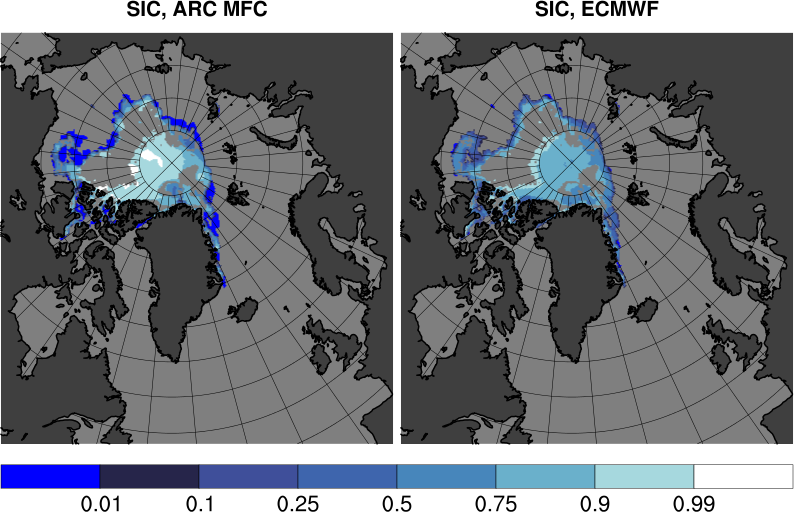
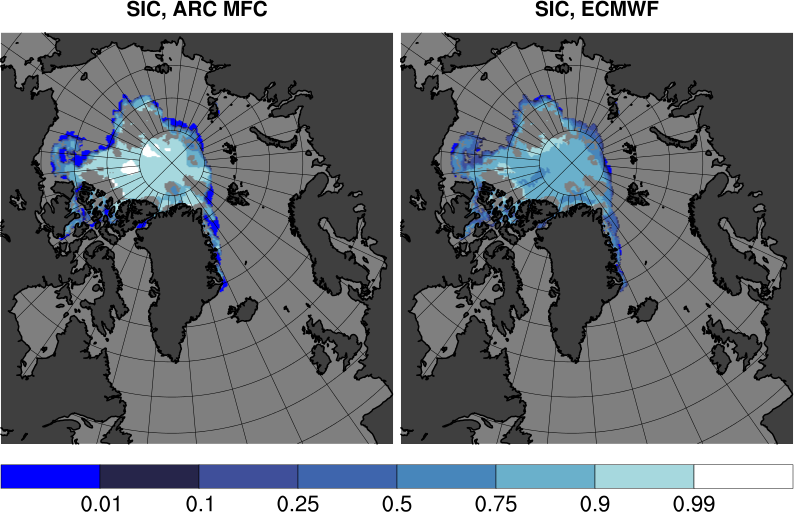
Map plots for SIC differences
| Forecast @+00h | Forecast @+24h | Forecast @+120h | Forecast @+216h |
Initialization state
|
Forecast @+00h |
Forecast @+24h |
Forecast @+120h |
Forecast @+216h |
| Forecast @+00h | Forecast @+24h | Forecast @+120h | Forecast @+216h |
ARC MFC 1 day forecast
|
Forecast @+00h |
Forecast @+24h |
Forecast @+120h |
Forecast @+216h |

| Forecast @+00h | Forecast @+24h | Forecast @+120h | Forecast @+216h |
ARC MFC 5 day forecast
|
Forecast @+00h |
Forecast @+24h |
Forecast @+120h |
Forecast @+216h |
| Forecast @+00h | Forecast @+24h | Forecast @+120h | Forecast @+216h |
ARC MFC 9 day forecast
|
Forecast @+00h |
Forecast @+24h |
Forecast @+120h |
Forecast @+216h |
Generated by /metno/routine/sms/V2/SICmonitor/SICwebPage.sh Fri Sep 11 03:35:10 UTC 2020 on arcmfcval