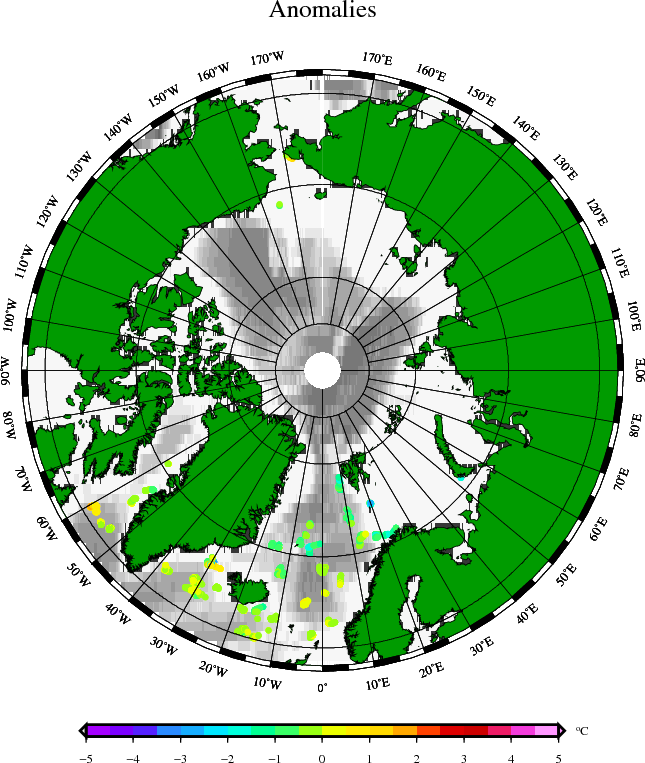
Period 2015 16- Nov.
Graph legend: 
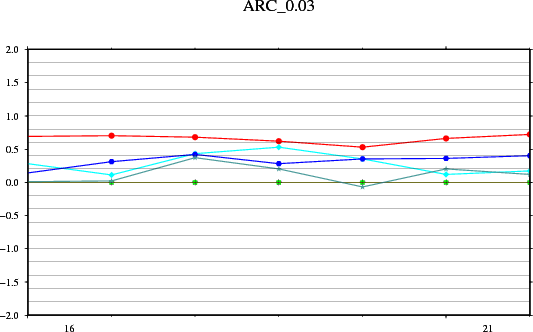
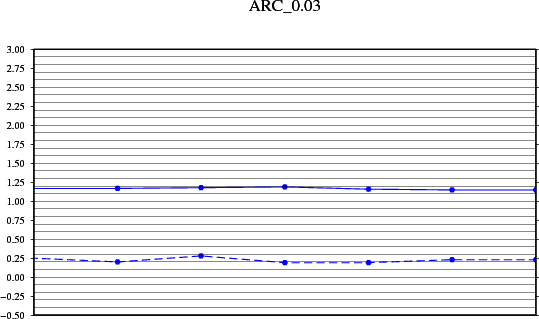
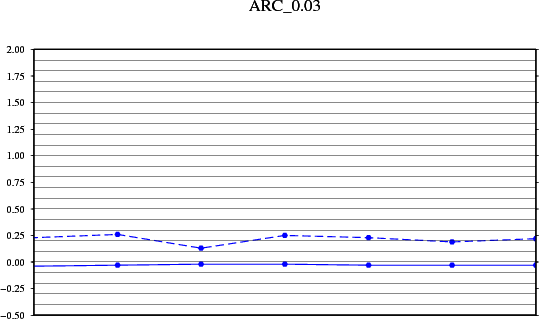
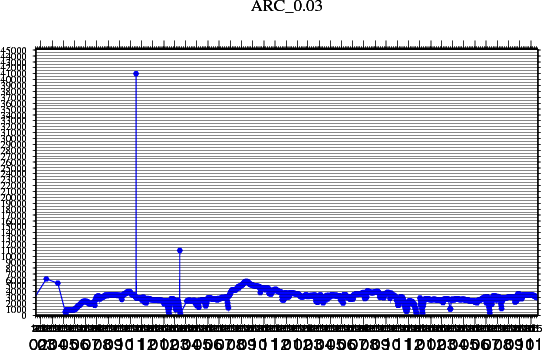
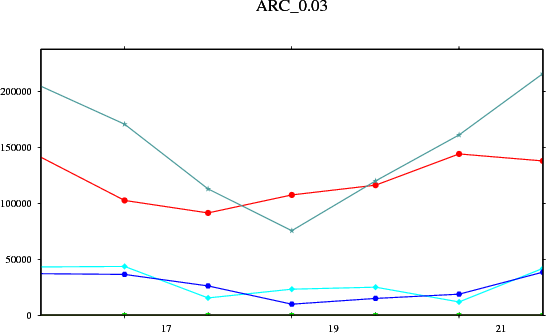
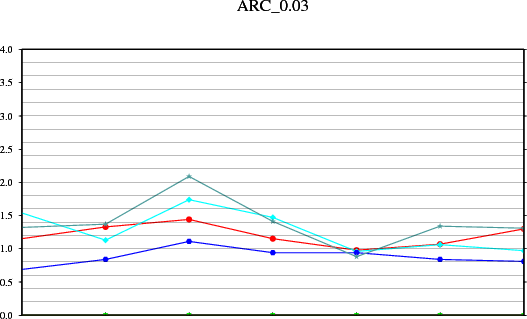
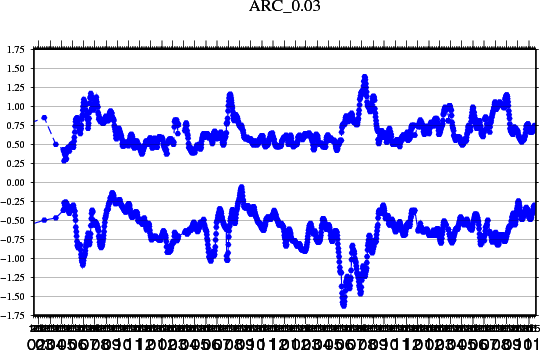
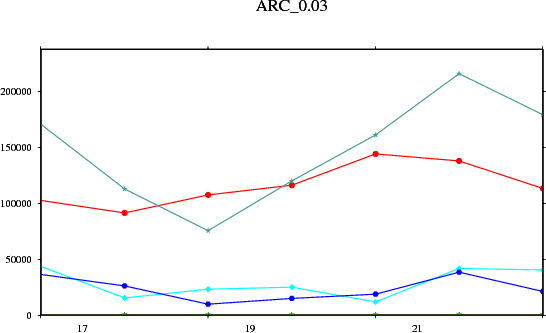
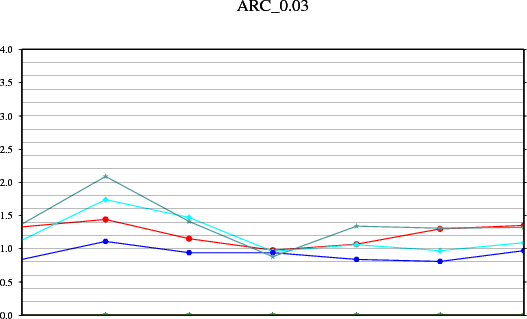
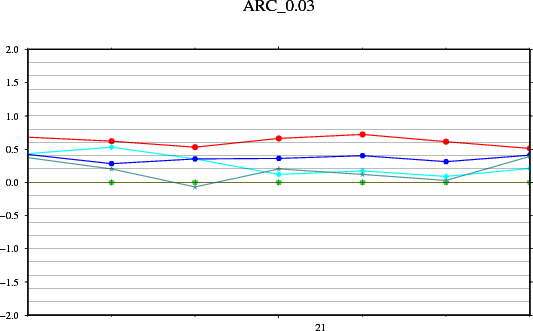
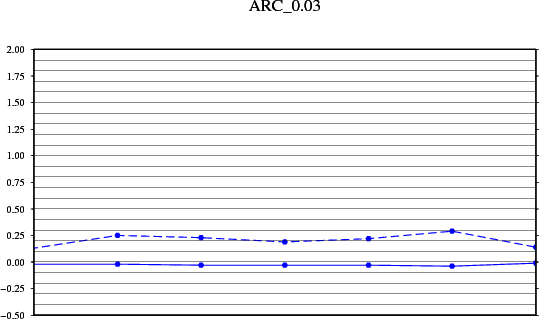
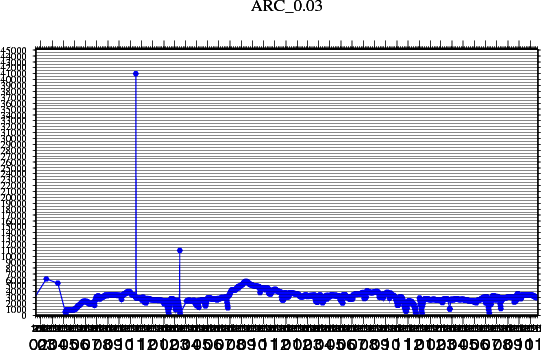
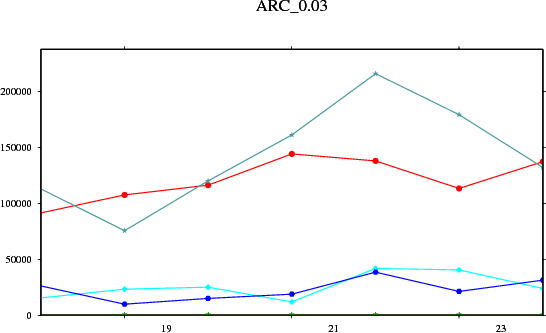
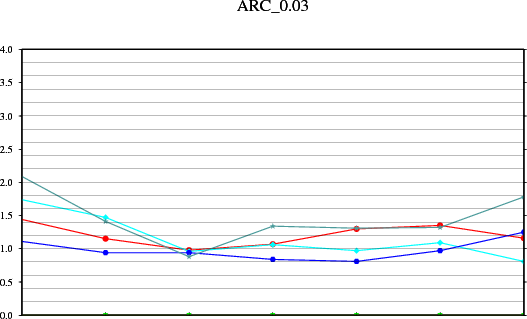
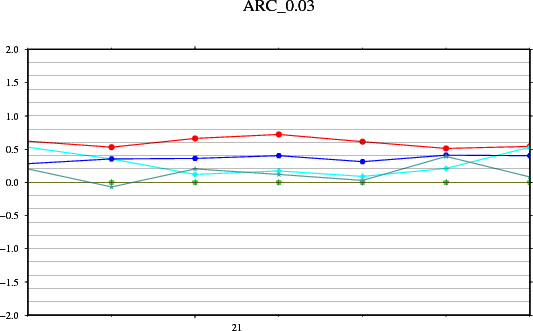
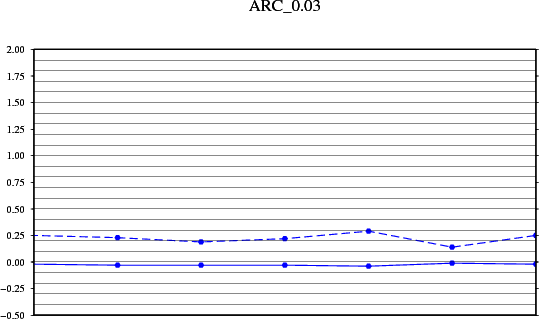
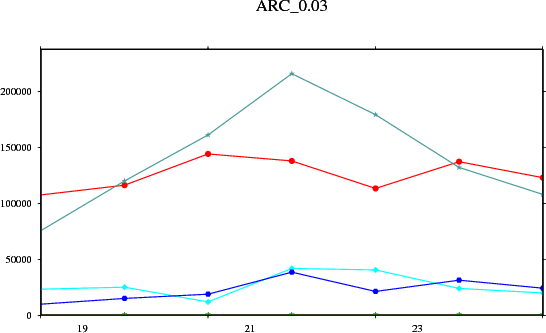
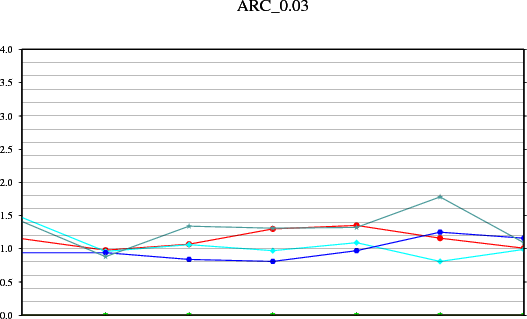
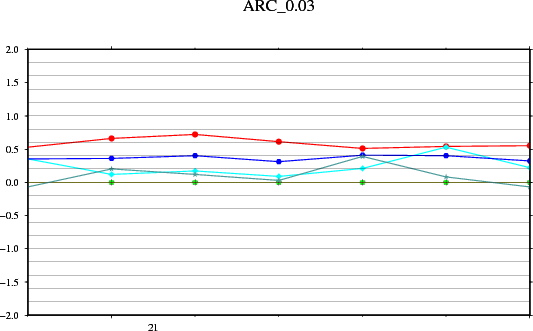
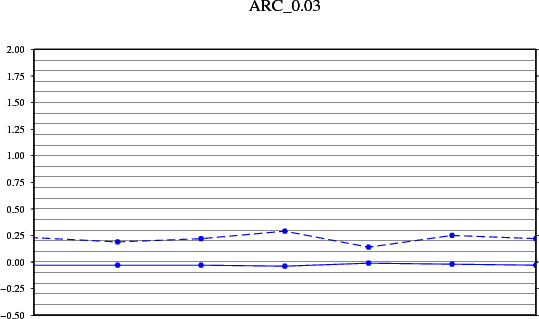
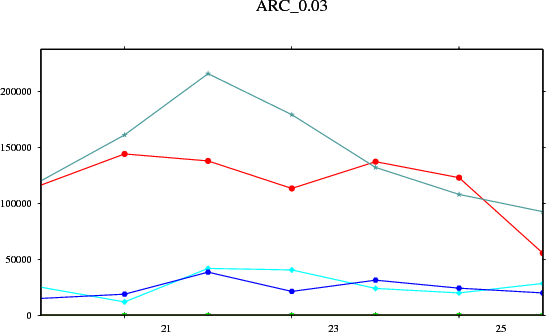
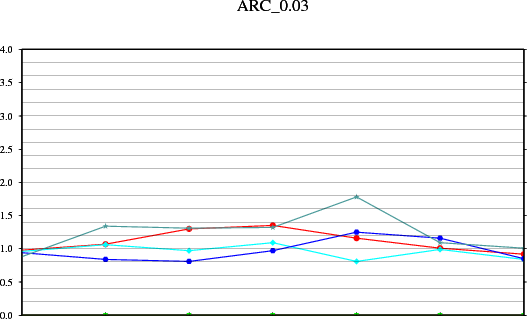
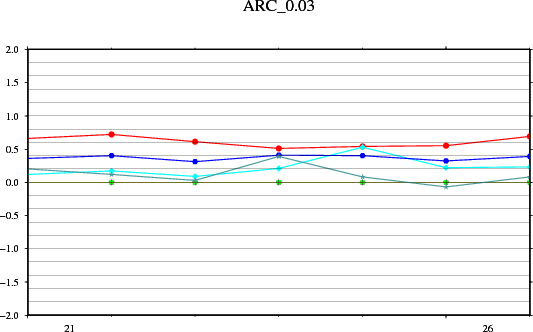
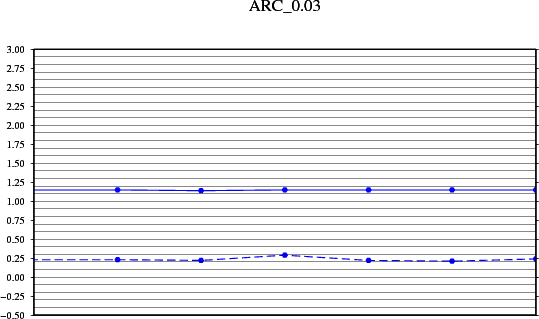
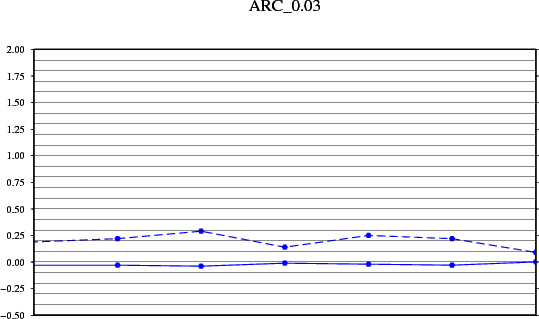
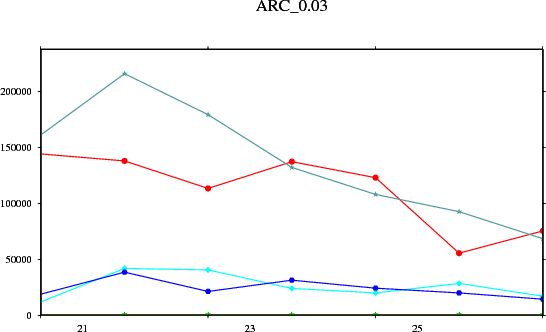
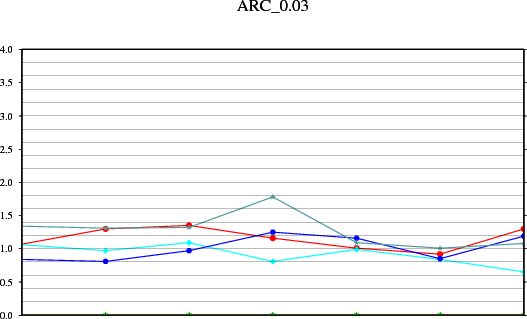
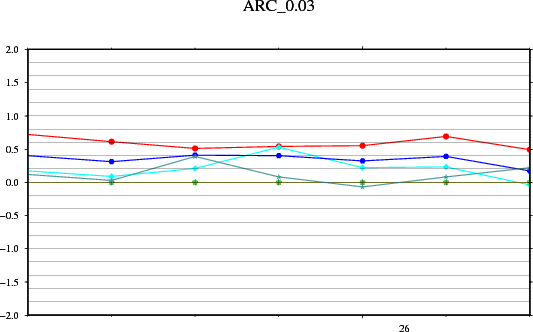
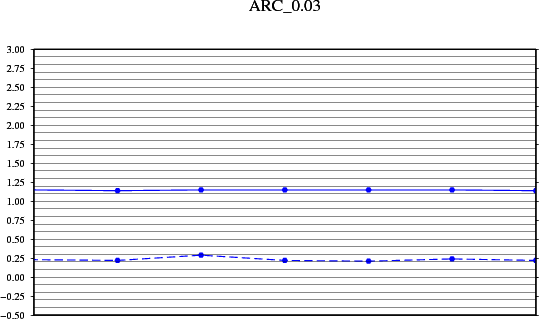
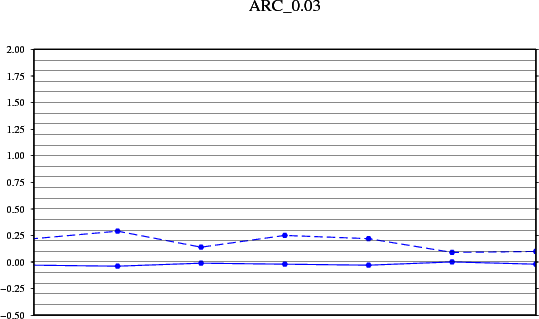
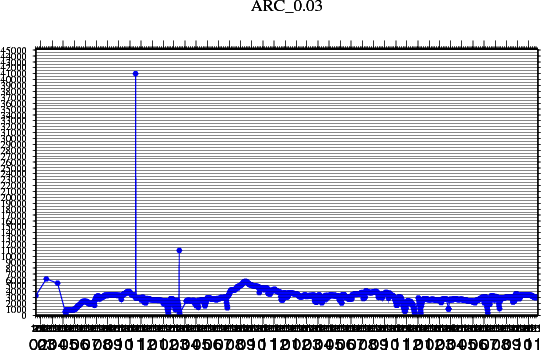
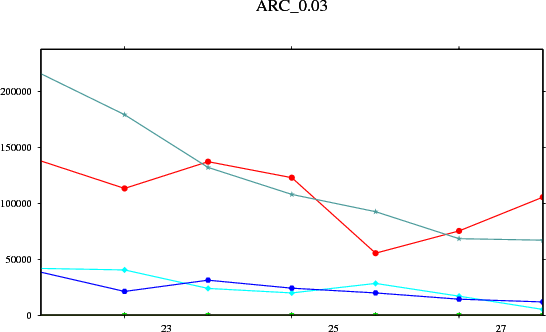
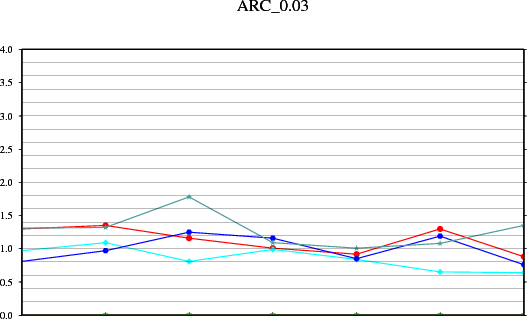
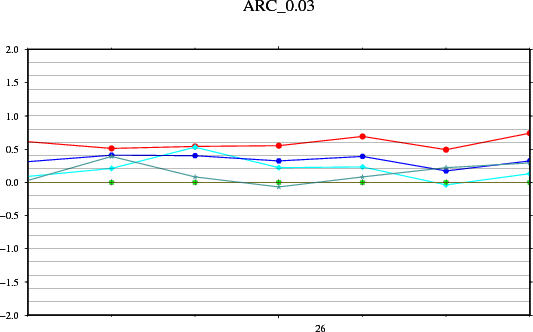
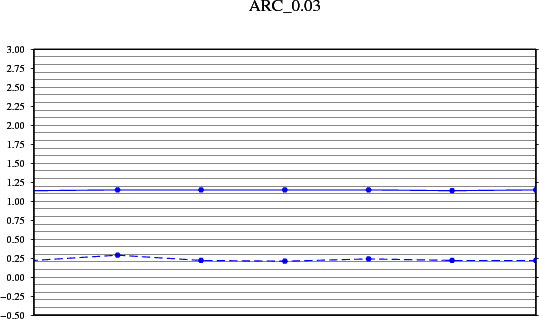
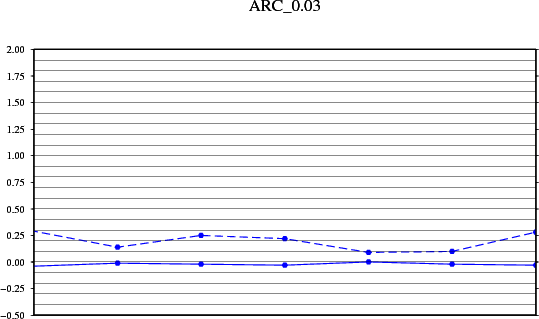
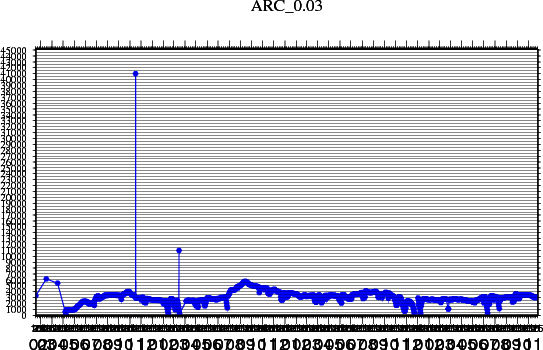
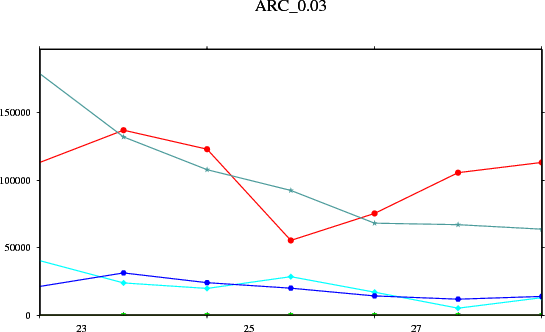
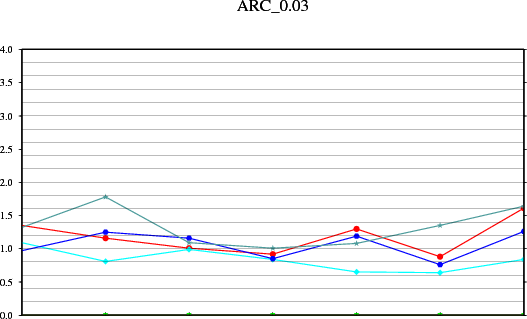
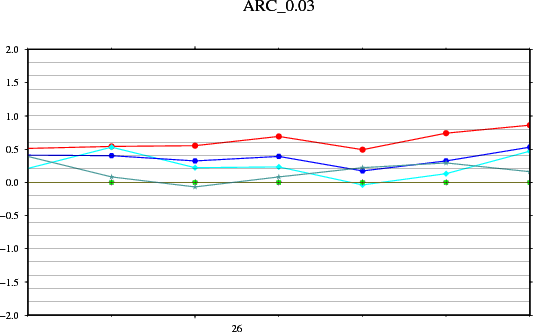
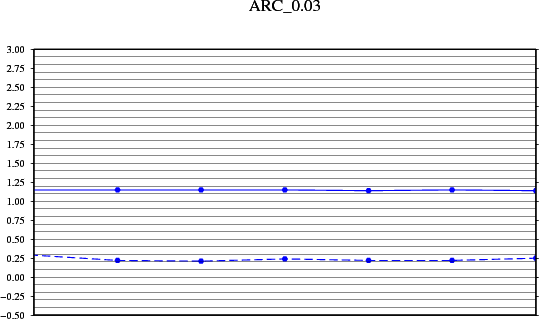
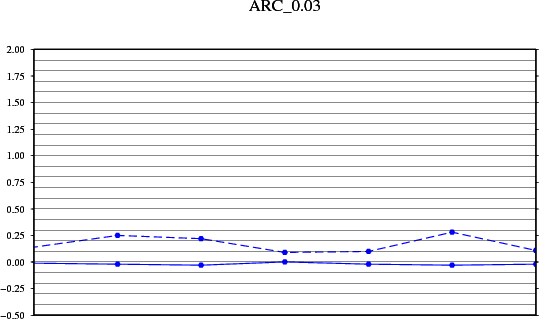
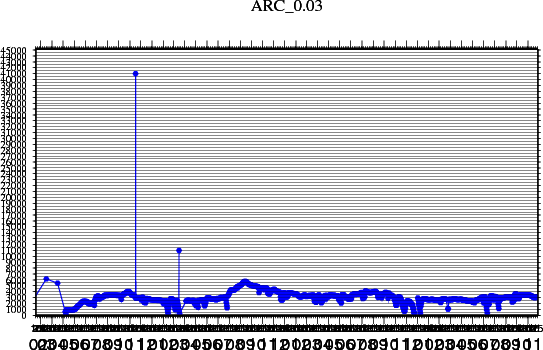
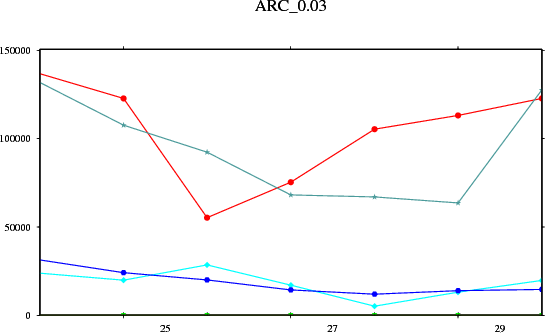
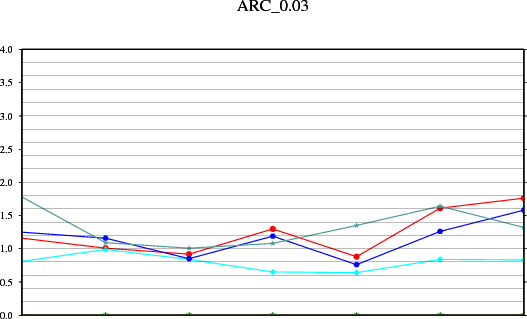
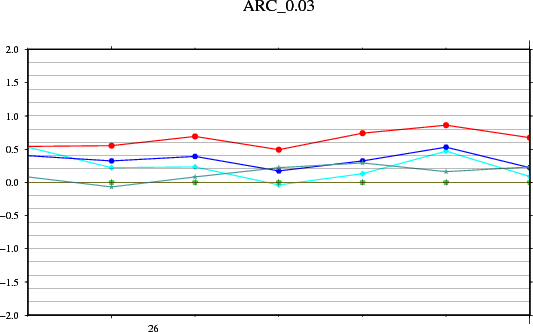
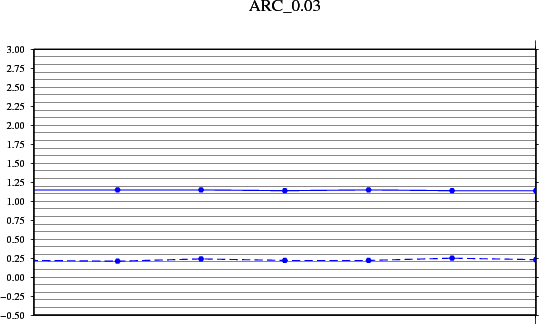
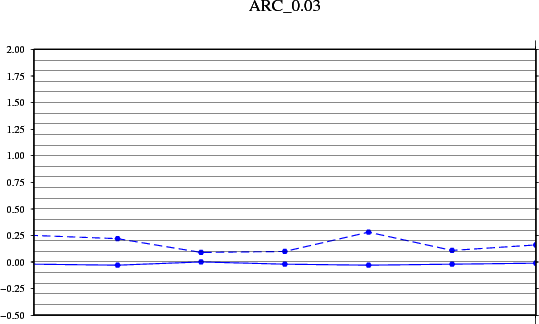
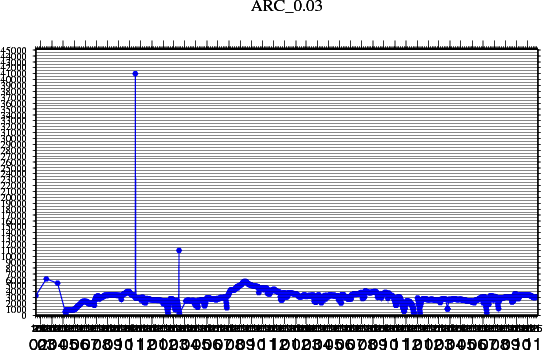
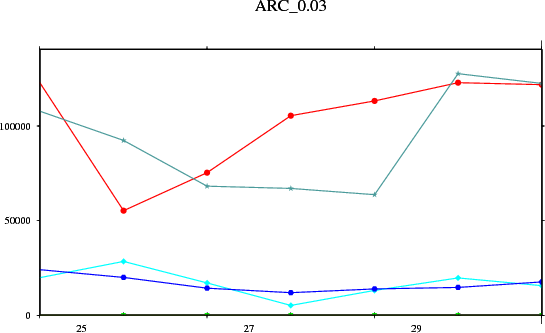
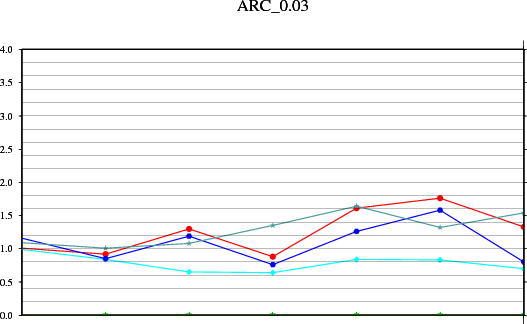
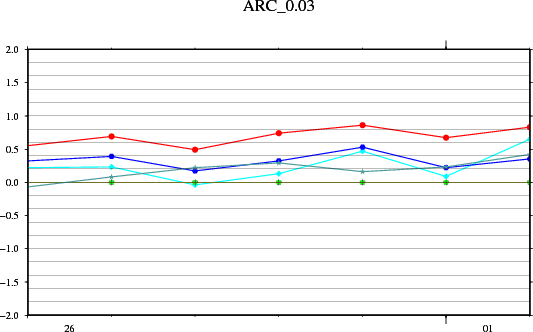
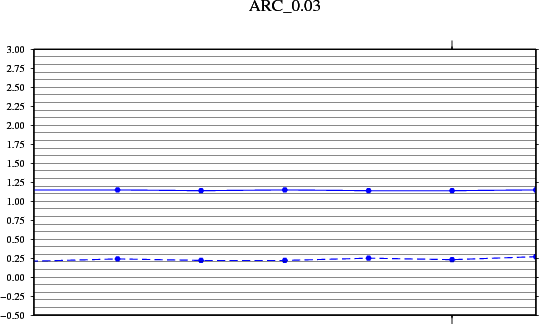
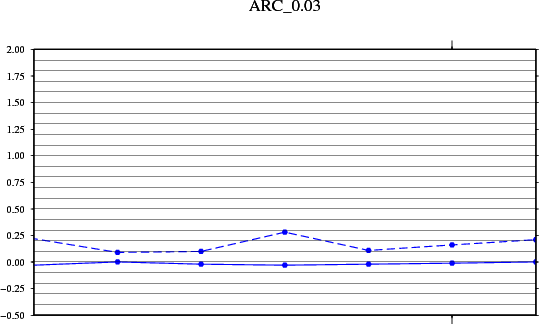
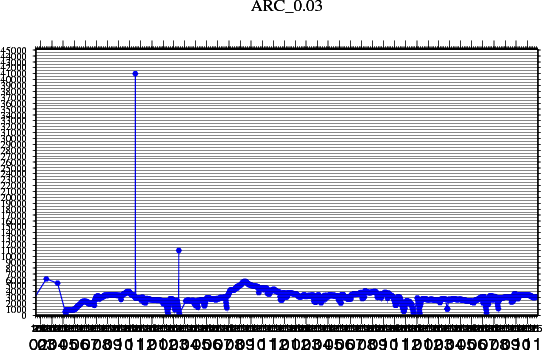
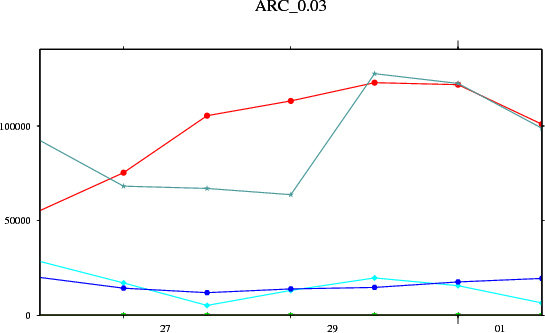
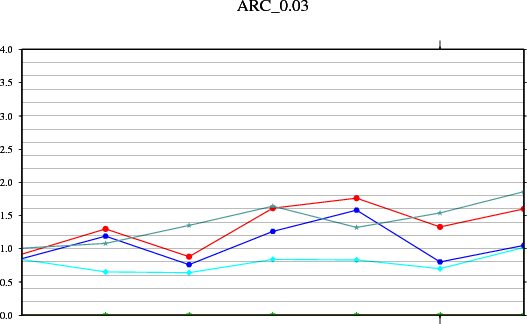
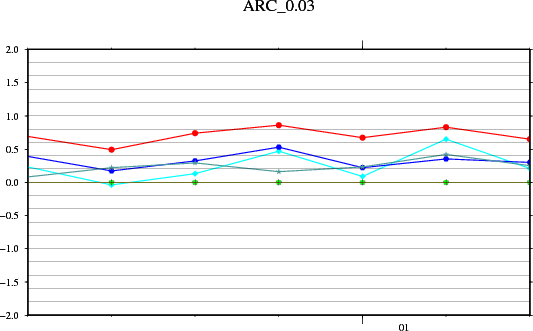
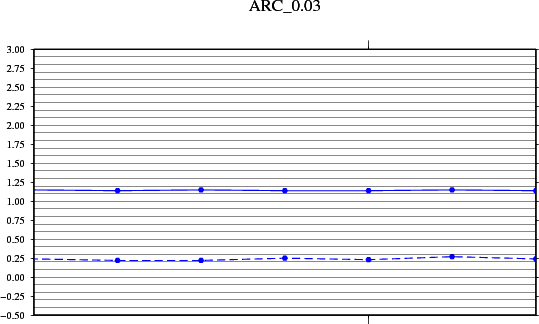
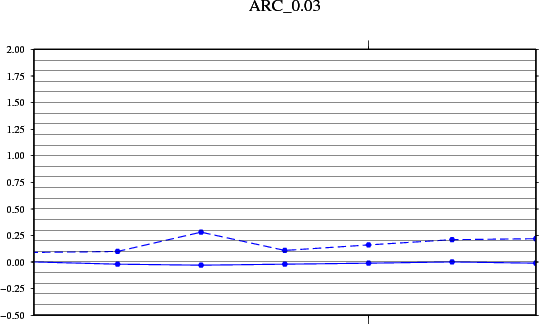
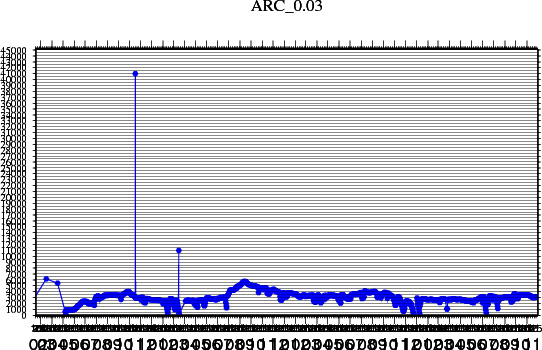
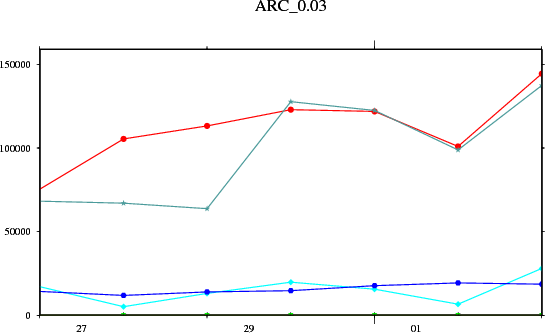
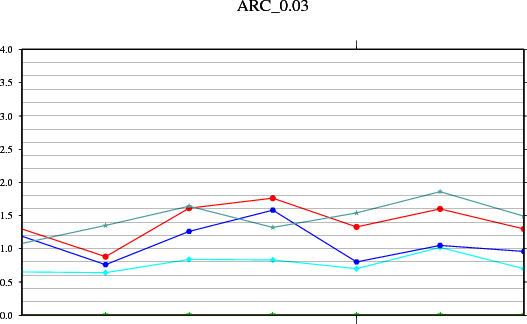
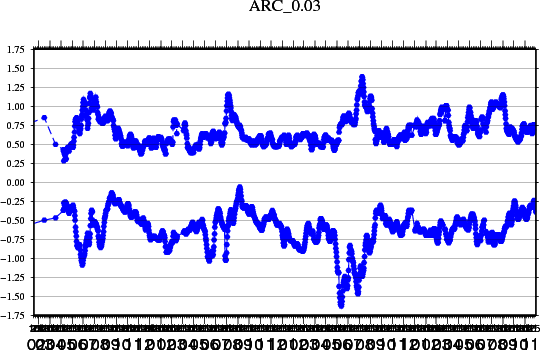
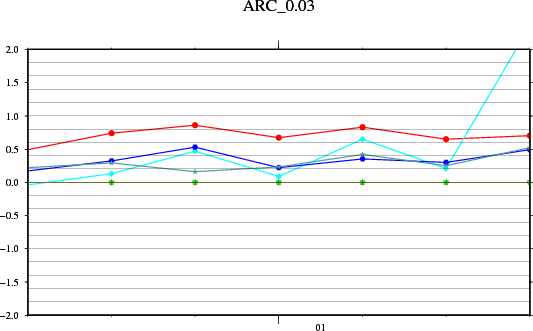
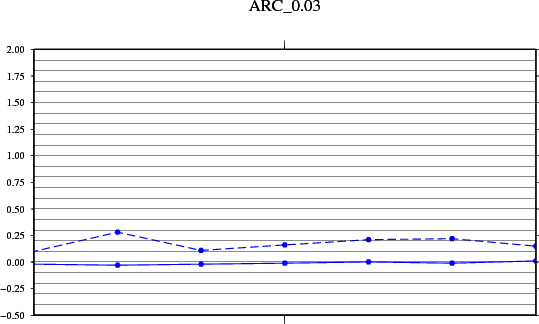
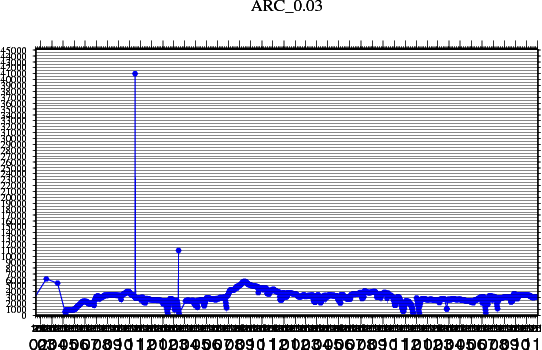
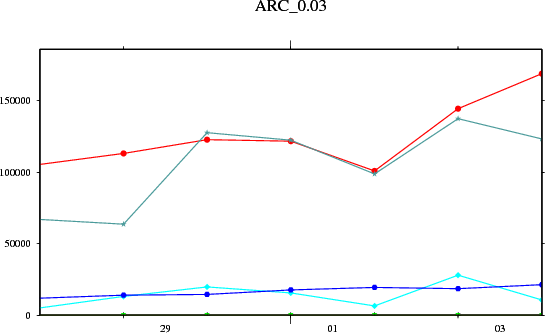
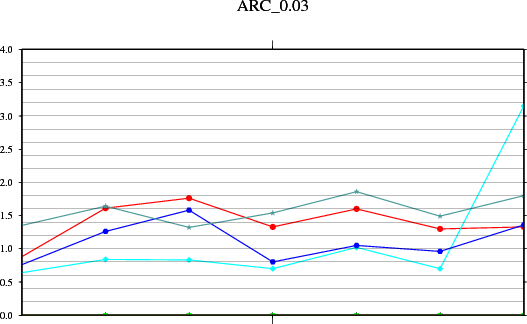
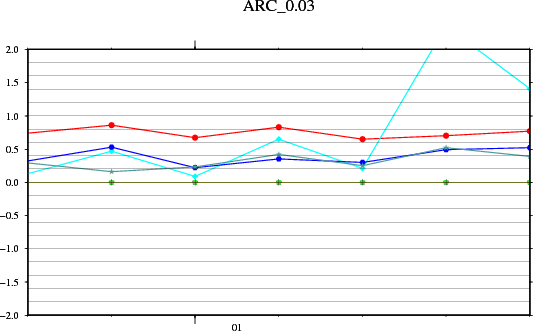
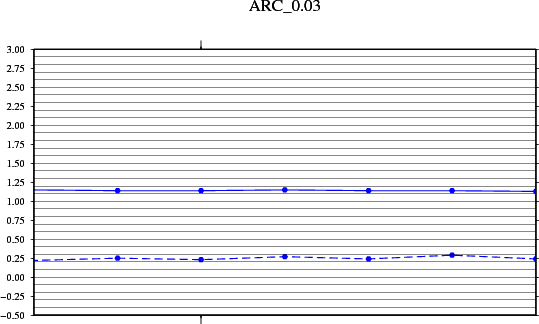
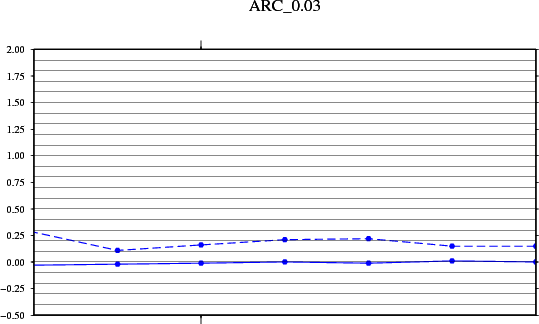
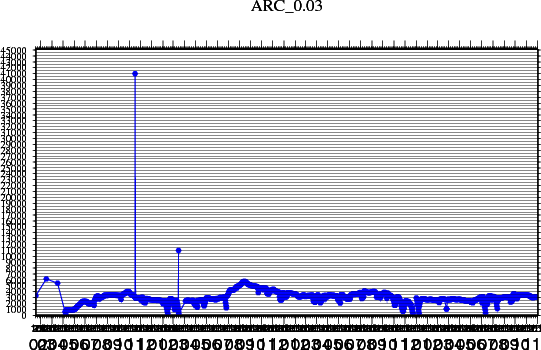
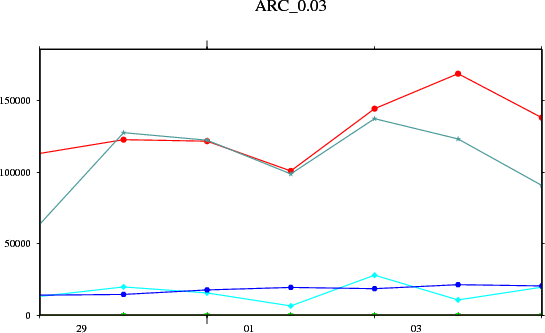
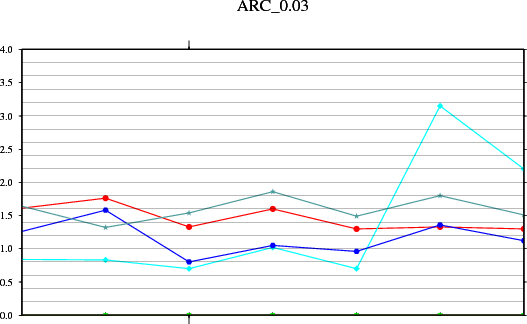
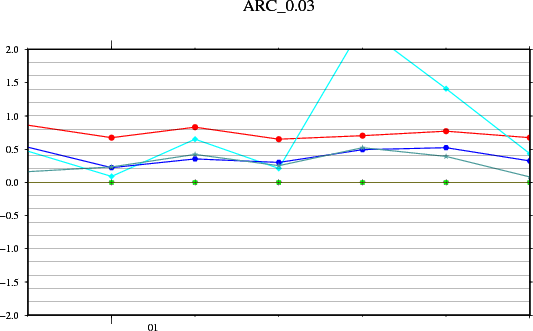
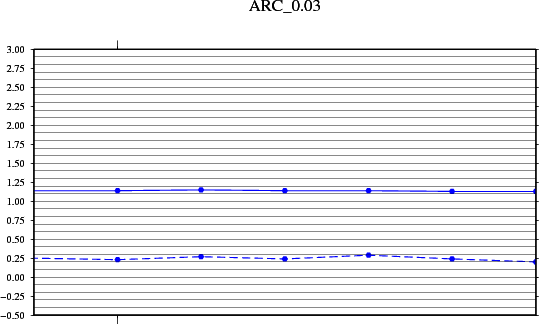
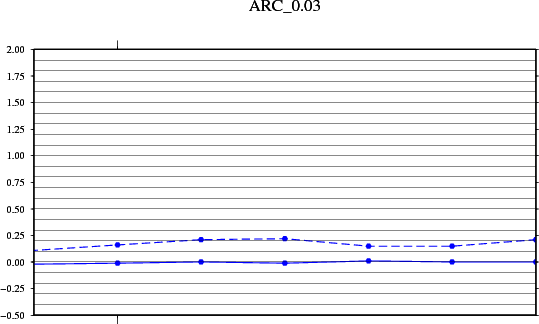
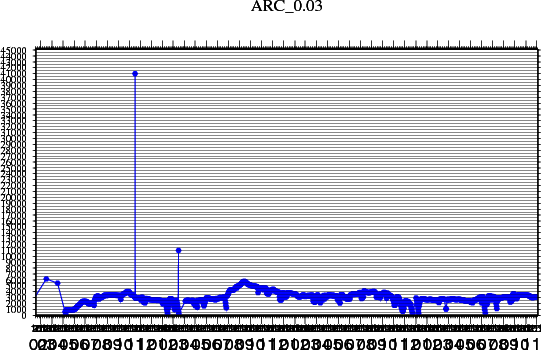
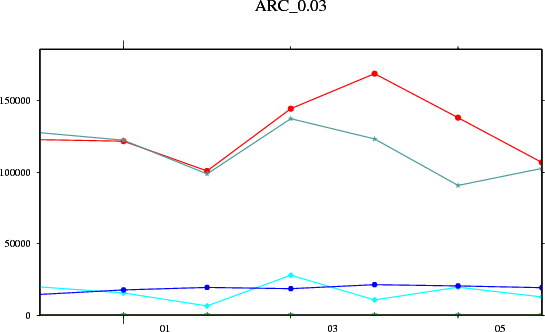
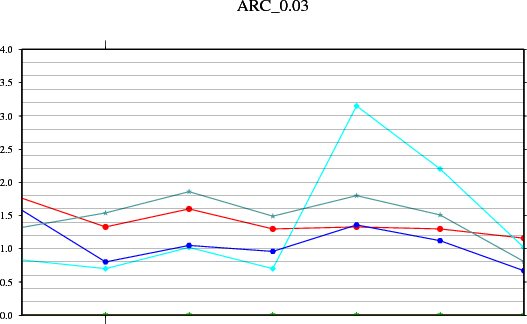
| Anomalies between SST from Coriolis bouys - SST analysis. Light grey area is ice. | |
|---|---|
| Startdate: 2015-11-16 Enddate: 2015-11-23 | |
 |
       |
| Startdate: 2015-11-17 Enddate: 2015-11-24 | |
 |
       |
| Startdate: 2015-11-18 Enddate: 2015-11-25 | |
 |
 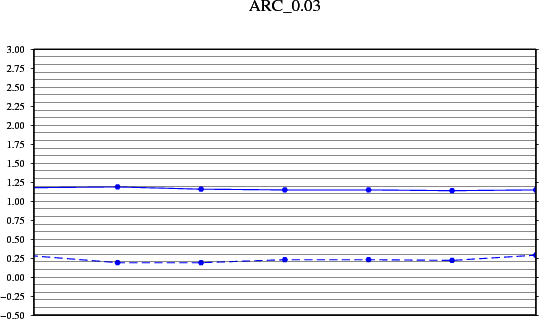      |
| Startdate: 2015-11-19 Enddate: 2015-11-26 | |
 |
       |
| Startdate: 2015-11-20 Enddate: 2015-11-27 | |
 |
       |
| Startdate: 2015-11-21 Enddate: 2015-11-28 | |
 |
       |
| Startdate: 2015-11-22 Enddate: 2015-11-29 | |
 |
       |
| Startdate: 2015-11-23 Enddate: 2015-11-30 | |
 |
       |
| Startdate: 2015-11-24 Enddate: 2015-12-01 | |
 |
       |
| Startdate: 2015-11-25 Enddate: 2015-12-02 | |
 |
       |
| Startdate: 2015-11-26 Enddate: 2015-12-03 | |
 |
       |
| Startdate: 2015-11-27 Enddate: 2015-12-04 | |
 |
       |
| Startdate: 2015-11-28 Enddate: 2015-12-05 | |
 |
       |
| Startdate: 2015-11-29 Enddate: 2015-12-06 | |
 |
       |
| Startdate: 2015-11-30 Enddate: 2015-12-07 | |
 |
       |