Copernicus Marine Service Arctic MFC: Validation of temperature and salinity profiles

Computation of anomaly correlations include use of monthly depth interval (layer) climatologies. These were derived from the World Ocean Atlas data.

Validation based on data from profiling buoys

Validation of the Copernicus Marine Arctic MFC results for ocean temperature, salinity and mixed layer depth is performed using data from profiling buoys, which are compiled by the Copernicus Marine In Situ TAC. New sets of buoy data are available daily, while each buoy provides one profile for each 10-day period. The data are available from Argo buoys, with most buoys covering a depth range of 0-2000 m. Read more about the Argo project here.

Bias is defined as averages of model values - observed values.

Profile data are available from the Copernicus Marine Sea Surface Temperature TAC as product INSITU_ARC_NRT_OBSERVATIONS_013_031, and from a web interface to the NMD data (in Norwegian).

Results by bulletin date
January 2024
01-04
01-11
01-18
01-25

February 2024
02-01
02-08
02-15
02-22
02-29

March 2024
03-07
03-14
03-21
03-28

January 2023
01-05
01-12
01-19
01-26

February 2023
02-02
02-09
02-16
02-23

March 2023
03-02
03-09
03-16
03-23
03-30

April 2023
04-06
04-13
04-20
04-27

May 2023
05-04
05-11
05-18
05-25

June 2023
06-01
06-08
06-15
06-22
06-29

July 2023
07-06
07-13
07-20
07-27

August 2023
08-03
08-10
08-17
08-24
08-31

September 2023
09-07
09-14
09-21
09-28

October 2023
10-05
10-12
10-19
10-26

November 2023
11-02
11-09
11-16
11-23
11-30

December 2023
12-07
12-14
12-21
12-28

January 2022
01-06
01-13
01-20
01-27

February 2022
02-03
02-10
02-17
02-24

March 2022
03-03
03-10
03-17
03-24
03-31

April 2022
04-07
04-14
04-21
04-28

May 2022
05-05
05-12
05-19
05-26

June 2022
06-02
06-09
06-16
06-23
06-30

July 2022
07-07
07-14
07-21
07-28

August 2022
08-04
08-11
08-18
08-25

September 2022
09-01
09-08
09-15
09-22
09-29

October 2022
10-06
10-13
10-20
10-27

November 2022
11-03
11-10
11-17
11-24

December 2022
12-01
12-08
12-15
12-22
12-29

January 2021
01-07
01-14
01-21
01-28

February 2021
02-04
02-11
02-18
02-25

March 2021
03-04
03-11
03-18
03-25

April 2021
04-01
04-08
04-15
04-22
04-29

May 2021
05-06
05-13
05-20
05-27

June 2021
06-03
06-10
06-17
06-24

July 2021
07-01
07-08
07-15
07-22
07-29

August 2021
08-05
08-12
08-19
08-26

September 2021
09-02
09-09
09-16
09-23
09-30

October 2021
10-07
10-14
10-21
10-28

November 2021
11-04
11-11
11-18
11-25

December 2021
12-02
12-09
12-16
12-23
12-30

January 2020
01-02
01-09
01-16
01-23
01-30

February 2020
02-06
02-13
02-20
02-27

March 2020
03-05
03-12
03-19
03-26

April 2020
04-02
04-09
04-16
04-23
04-30

May 2020
05-07
05-14
05-21
05-28

June 2020
06-04
06-11
06-18
06-25

July 2020
07-02
07-09
07-16
07-23
07-30

August 2020
08-06
08-13
08-20
08-27

September 2020
09-03
09-10
09-17
09-24

October 2020
10-01
10-08
10-15
10-22
10-29

November 2020
11-05
11-12
11-19
11-26

December 2020
12-03
12-10
12-17
12-24
12-31

January 2019
01-03
01-10
01-17
01-24
01-31

February 2019
02-07
02-14
02-21
02-28

March 2019
03-07
03-14
03-21
03-28

April 2019
04-04
04-11
04-18
04-25

May 2019
05-02
05-09
05-16
05-23
05-30

June 2019
06-06
06-13
06-20
06-27

July 2019
07-04
07-11
07-18
07-25

August 2019
08-01
08-08
08-15
08-22
08-29

September 2019
09-05
09-12
09-19
09-26

October 2019
10-03
10-10
10-17
10-24
10-31

November 2019
11-07
11-14
11-21
11-28

December 2019
12-05
12-12
12-19
12-26

January 2018
01-04
01-11
01-18
01-25

February 2018
02-01
02-08
02-15
02-22

March 2018
03-01
03-08
03-15
03-22
03-29

April 2018
04-05
04-12
04-19
04-26

May 2018
05-03
05-10
05-17
05-24
05-31

June 2018
06-07
06-14
06-21
06-28

July 2018
07-05
07-12
07-19
07-26

August 2018
08-02
08-09
08-16
08-23
08-30

September 2018
09-06
09-13
09-20
09-27

October 2018
10-04
10-11
10-18
10-25

November 2018
11-01
11-08
11-15
11-22
11-29

December 2018
12-06
12-13
12-20
12-27

January 2017
01-05
01-12
01-19
01-26

February 2017
02-02
02-09
02-16
02-23

March 2017
03-02
03-09
03-16
03-23
03-30

April 2017
04-06
04-13
04-20
04-27

May 2017
05-04
05-11
05-18
05-25

June 2017
06-01
06-08
06-15
06-22
06-29

July 2017
07-06
07-13
07-20
07-27

August 2017
08-03
08-10
08-17
08-24
08-31

September 2017
09-07
09-14
09-21
09-28

October 2017
10-05
10-12
10-19
10-26

November 2017
11-02
11-09
11-16
11-23
11-30

December 2017
12-07
12-14
12-21
12-28

January 2016
01-07
01-14
01-21
01-28

February 2016
02-04
02-11
02-18
02-25

March 2016
03-03
03-10
03-17
03-24
03-31

April 2016
04-07
04-14
04-21
04-28

May 2016
05-05
05-12
05-19
05-26

June 2016
06-02
06-09
06-16
06-23
06-30

July 2016
07-07
07-14
07-21
07-28

August 2016
08-04
08-11
08-18
08-25

September 2016
09-01
09-08
09-15
09-22
09-29

October 2016
10-06
10-13
10-20
10-27

November 2016
11-03
11-10
11-17
11-24

December 2016
12-01
12-08
12-15
12-22
12-29

January 2015
01-01
01-08
01-15
01-22
01-29

February 2015
02-05
02-12
02-19
02-26

March 2015
03-05
03-12
03-19
03-26

April 2015
04-02
04-09
04-16
04-23
04-30

May 2015
05-07
05-14
05-21
05-28

June 2015
06-04
06-11
06-18
06-25

July 2015
07-02
07-09
07-16
07-23
07-30

August 2015
08-06
08-13
08-20
08-27

September 2015
09-03
09-10
09-17
09-24

October 2015
10-01
10-08
10-15
10-22
10-29

November 2015
11-05
11-12
11-19
11-26

December 2015
12-03
12-10
12-17
12-24
12-31

January 2014
01-02
01-09
01-16
01-23
01-30

February 2014
02-06
02-13
02-20
02-27

March 2014
03-06
03-13
03-20
03-27

April 2014
04-03
04-10
04-17
04-24

May 2014
05-01
05-08
05-15
05-22
05-29

June 2014
06-05
06-12
06-19
06-26

July 2014
07-03
07-10
07-17
07-24
07-31

August 2014
08-07
08-14
08-21
08-28

September 2014
09-04
09-11
09-18
09-25

October 2014
10-02
10-09
10-16
10-23
10-30

November 2014
11-06
11-13
11-20
11-27

December 2014
12-04
12-11
12-18
12-25

January 2013
01-03
01-10
01-17
01-24
01-31

February 2013
02-07
02-14
02-21
02-28

March 2013
03-07
03-14
03-21
03-28

April 2013
04-04
04-11
04-18
04-25

May 2013
05-02
05-09
05-16
05-23
05-30

June 2013
06-06
06-13
06-20
06-27

July 2013
07-04
07-11
07-18
07-25

August 2013
08-01
08-08
08-15
08-22
08-29

September 2013
09-05
09-12
09-19
09-26

October 2013
10-03
10-10
10-17
10-24
10-31

November 2013
11-07
11-14
11-21
11-28

December 2013
12-05
12-12
12-19
12-26

January 2012
01-04
01-11
01-18
01-25

February 2012
02-01
02-08
02-15
02-22
02-29

March 2012
03-07
03-14
03-21
03-28

April 2012
04-04
04-11
04-18
04-25

May 2012
05-02
05-09
05-16
05-23
05-30

June 2012
06-06
06-07
06-14
06-21
06-28

July 2012
07-05
07-12
07-19
07-26

August 2012
08-02
08-09
08-16
08-23
08-30

September 2012
09-06
09-13
09-20
09-27

October 2012
10-04
10-11
10-18
10-25

November 2012
11-01
11-08
11-15
11-22
11-29

December 2012
12-06
12-13
12-20
12-27

December 2011
12-28

Validation based on data from CTD profiles

The ARGO program does not provide observations from shelf regions. Therefore, the above validation is complemented by comparisons of model results and CTD profiles from scientific-level cruises. These validation statistics is updated on a quarterly basis.

Maps show temperature and salinity bias averaged over the water column from 5 m depth to 2000 m depth, or the bottom (model or actual) or maximum CTD depth in places where the bottom (model or actual) or maximum CTD depth is less than 2000 m. For the mixed-layer depth comparison, the bias is set to zero if both the model and observations indicate mixing to the bottom, irrespective of any differences in model and actual bottom depth in the position.

CTD data are downloaded from the Copernicus Marine product INSITU_ARC_NRT_OBSERVATIONS_013_031.

Results by annual quarters
2018         2019         2020         2021         2022         2023        
Jan-Mar
Apr-Jun
Jul-Sep
Oct-Dec
Jan-Mar
Apr-Jun
Jul-Sep
Oct-Dec
Jan-Mar
Apr-Jun
Jul-Sep
Oct-Dec
Jan-Mar
Apr-Jun
Jul-Sep
Oct-Dec
Jan-Mar
Apr-Jun
Jul-Sep
Oct-Dec
Jan-Mar
Apr-Jun
Jul-Sep
Oct-Dec

Validation based on data from ITPs

The ARGO program does generally not provide observations from the Arctic Ocean. Therefore, the above validation is complemented by comparisons of model results and observations from Ice Tethered Profilers (ITPs). Read more about Ice Tethered Profilers here.

Woods Hole Oceanographic Institution (WHOI) coordinates the ITP program. Data may be downloaded as part of the Copernicus Marine product INSITU_ARC_NRT_OBSERVATIONS_013_031. The present locations of active ITPs are shown on a map from the web pages from WHOI.

Results by bulletin date
January 2024
01-04
01-11
01-18
01-25

February 2024
02-01
02-08
02-15
02-22
02-29

March 2024
03-07
03-14
03-21
03-28

January 2023
01-05
01-12
01-19
01-26

February 2023
02-02
02-09
02-16
02-23

March 2023
03-02
03-09
03-16
03-23
03-30

April 2023
04-06
04-13
04-20
04-27

May 2023
05-04
05-11
05-18
05-25

June 2023
06-01
06-08
06-15
06-22
06-29

July 2023
07-06
07-13
07-20
07-27

August 2023
08-03
08-10
08-17
08-24
08-31

September 2023
09-07
09-14
09-21
09-28

October 2023
10-05
10-12
10-19
10-26

November 2023
11-02
11-09
11-16
11-23
11-30

December 2023
12-07
12-14
12-21
12-28

January 2022
01-06
01-13
01-20
01-27

February 2022
02-03
02-10
02-17
02-24

March 2022
03-03
03-10
03-17
03-24
03-31

April 2022
04-07
04-14
04-21
04-28

May 2022
05-05
05-12
05-19
05-26

June 2022
06-02
06-09
06-16
06-23
06-30

July 2022
07-07
07-14
07-21
07-28

August 2022
08-04
08-11
08-18
08-25

September 2022
09-01
09-08
09-15
09-22
09-29

October 2022
10-06
10-13
10-20
10-27

November 2022
11-03
11-10
11-17
11-24

December 2022
12-01
12-08
12-15
12-22
12-29

January 2021
01-07
01-14
01-21
01-28

February 2021
02-04
02-11
02-18
02-25

March 2021
03-04
03-11
03-18
03-25

April 2021
04-01
04-08
04-15
04-22
04-29

May 2021
05-06
05-13
05-20
05-27

June 2021
06-03
06-10
06-17
06-24

July 2021
07-01
07-08
07-15
07-22
07-29

August 2021
08-05
08-12
08-19
08-26

September 2021
09-02
09-09
09-16
09-23
09-30

October 2021
10-07
10-14
10-21
10-28

November 2021
11-04
11-11
11-18
11-25

December 2021
12-02
12-09
12-16
12-23
12-30

January 2020
01-02
01-09
01-16
01-23
01-30

February 2020
02-06
02-13
02-20
02-27

March 2020
03-05
03-12
03-19
03-26

April 2020
04-02
04-09
04-16
04-23
04-30

May 2020
05-07
05-14
05-21
05-28

June 2020
06-04
06-11
06-18
06-25

July 2020
07-02
07-09
07-16
07-23
07-30

August 2020
08-06
08-13
08-20
08-27

September 2020
09-03
09-10
09-17
09-24

October 2020
10-01
10-08
10-15
10-22
10-29

November 2020
11-05
11-12
11-19
11-26

December 2020
12-03
12-10
12-17
12-24
12-31

January 2019
01-03
01-10
01-17
01-24
01-31

February 2019
02-07
02-14
02-21
02-28

March 2019
03-07
03-14
03-21
03-28

April 2019
04-04
04-11
04-18
04-25

May 2019
05-02
05-09
05-16
05-23
05-30

June 2019
06-06
06-13
06-20
06-27

July 2019
07-04
07-11
07-18
07-25

August 2019
08-01
08-08
08-15
08-22
08-29

September 2019
09-05
09-12
09-19
09-26

October 2019
10-03
10-10
10-17

December 2019
12-12
12-19
12-26

January 2018
01-04
01-11
01-18
01-25

February 2018
02-01
02-08
02-15
02-22

March 2018
03-01
03-08
03-15
03-22
03-29

April 2018
04-05
04-12
04-19
04-26

May 2018
05-03
05-10
05-17
05-24
05-31

June 2018
06-07
06-14
06-21
06-28

July 2018
07-19
07-26

August 2018
08-02
08-09
08-16
08-23
08-30

September 2018
09-06
09-13
09-20
09-27

October 2018
10-04
10-11
10-18
10-25

November 2018
11-01
11-08
11-15
11-22
11-29

December 2018
12-06
12-13
12-20
12-27

January 2017
01-05
01-12
01-19
01-26

February 2017
02-02
02-09
02-16
02-23

March 2017
03-02
03-09
03-16
03-23
03-30

April 2017
04-06
04-13
04-20
04-27

May 2017
05-04
05-11
05-18
05-25

June 2017
06-01
06-08
06-15
06-22
06-29

July 2017
07-06
07-13
07-20
07-27

August 2017
08-03
08-10
08-17
08-24
08-31

September 2017
09-07
09-14
09-21
09-28

October 2017
10-05
10-12
10-19
10-26

November 2017
11-02
11-09
11-16
11-23
11-30

December 2017
12-07
12-14
12-21
12-28

January 2016
01-07
01-14
01-21
01-28

February 2016
02-04
02-11
02-18
02-25

March 2016
03-03
03-10
03-17
03-24
03-31

April 2016
04-07
04-14
04-21
04-28

May 2016
05-05
05-12
05-19
05-26

June 2016
06-02
06-09
06-16
06-23
06-30

July 2016
07-07
07-14
07-21
07-28

August 2016
08-04
08-11
08-18
08-25

September 2016
09-01
09-08
09-15
09-22
09-29

October 2016
10-06
10-13
10-20
10-27

November 2016
11-03
11-10
11-17
11-24

December 2016
12-01
12-08
12-15
12-22
12-29

January 2015
01-01
01-08
01-15
01-22
01-29

February 2015
02-05
02-12
02-19
02-26

March 2015
03-05
03-12
03-19
03-26

April 2015
04-02
04-09
04-16
04-23
04-30

May 2015
05-07
05-14
05-21
05-28

June 2015
06-04
06-11
06-18
06-25

July 2015
07-02
07-09
07-16
07-23
07-30

August 2015
08-06
08-13
08-20
08-27

September 2015
09-03
09-10
09-17
09-24

October 2015
10-01
10-08
10-15
10-22
10-29

November 2015
11-05
11-12
11-19
11-26

December 2015
12-03
12-10
12-17
12-24
12-31

Layers

Validation of temperature and salinity profiles is conducted for depth averaged values in pre-defined depth intervals (layers). The intervals are

Profiling buoys CTD profiles ITPs
  • 0-5 m
  • 5-100 m
  • 100-300 m
  • 300-800 m
  • 800-2000 m

  • 10-100 m
  • 100-300 m
  • 300-800 m
  • 800-2000 m

  • 5-100 m
  • 100-300 m
  • 300-800 m

Regions

Validation regions

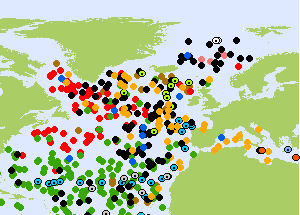
The ocean circulation model used in Copernicus Marine Arctic MFC covers the Arctic Ocean, the North Atlantic Ocean and adjacent ocean regions. The northern part is depicted in the figure to the left. Validation of temperature and salinity profiles from model results are performed for two domains:

  • an extended domain indicated by the blue and green regions in the figure
  • the Nordic Seas, shown as the green region

However, note that there are rarely any ARGO profile data north of the Nordic Seas, so almost all ARGO observations are either inside of the green region, or in the North Atlantic Ocean and the Labrador Sea (the part of the blue region to the south and to the west of the Nordic Seas). A sample map of the distribution of ARGO profiles (right) illustrates this limitation. ITP data are available from the Arctic Ocean only.


ARC-MFC PHYS

The model results are produced with the TOPAZ ocean data assimilation model system (Copernicus Marine product ARCTIC_ANALYSIS_FORECAST_PHYS_002_001_a). Presently, TOPAZ is run weekly with data assimillation one week prior to the bulletin date, followed by a one-week 100 member ensemble simulation ending on the bulletin date, and finally a 10 day deterministic forecast. TOPAZ was developed and is maintained by the Nansen Center.

ARC-MFC PHYS (TOPAZ) results are available as Copernicus Marine product ARCTIC_ANALYSIS_FORECAST_PHYS_002_001_a. An archive of historical forecasts are available from a thredds server.

 
See Met Privacy