Validation of ice thickness - Full domain
Bulletin date: 2023-11-30
Model: ARC MFC - TOPAZ
Data source: UCL CryoSAT-2 sea ice thickness
Validation statistics summary
| Bias (m) | RMS (m) | total grids | low SIT | OK SIT | high SIT | |
|---|---|---|---|---|---|---|
| Best estimate | -0.46 | 0.69 | 33361 | 6890 | 26444 | 27 |
| Day 1 forecast | -0.47 | 0.69 | 33361 | 7152 | 26180 | 29 |
| Day 4 forecast | -0.48 | 0.7 | 33361 | 7389 | 25945 | 27 |
| Day 7 forecast | -0.46 | 0.68 | 33361 | 6894 | 26437 | 30 |
| Day 10 forecast | -0.54 | 0.74 | 33361 | 8714 | 24628 | 19 |
Numbers in the three rightmost columns are grid counts. Regions with high/low sea ice thickness correspond to areas with model offsets from the gridded observations outside of one standard deviation. (Standard deviations are provided in the observational product.)
Definition of categories:
| Category | Sea ice thickness |
|---|---|
| c1 | <1m |
| c2 | 1 - 1.5m |
| c3 | 1.5 - 2m |
| c4 | 2 - 2.5m |
| c5 | 2.5 - 3m |
| c6 | >3m |
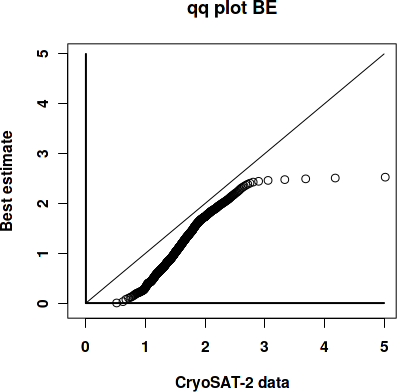
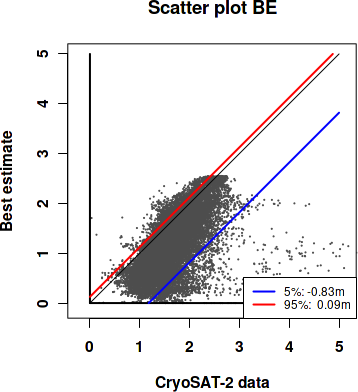
Best estimate vs. observations
Contingency table
| observations | |||||||||
|---|---|---|---|---|---|---|---|---|---|
| open | c1 | c2 | c3 | c4 | c5 | c6 | |||
| m o d e l |
open | 0 | 0 | 0 | 0.001 | 0 | 0 | 0 | |
| c1 | 0 | 0.047 | 0.315 | 0.076 | 0.01 | 0.002 | 0.005 | ||
| c2 | 0 | 0.001 | 0.088 | 0.139 | 0.024 | 0.002 | 0.002 | ||
| c3 | 0 | 0 | 0.014 | 0.141 | 0.063 | 0.005 | 0.001 | ||
| c4 | 0 | 0 | 0 | 0.012 | 0.036 | 0.01 | 0 | ||
| c5 | 0 | 0 | 0 | 0 | 0.002 | 0.002 | 0 | ||
| c6 | 0 | 0 | 0 | 0 | 0 | 0 | 0 | ||
See category definitions for details.
Statistical distribution
|
|
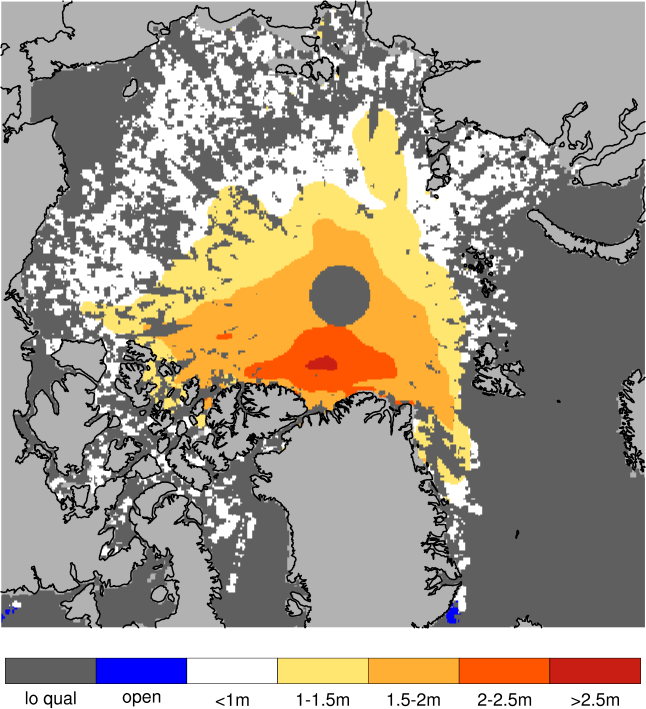
Observed sea ice thickness from CryoSAT
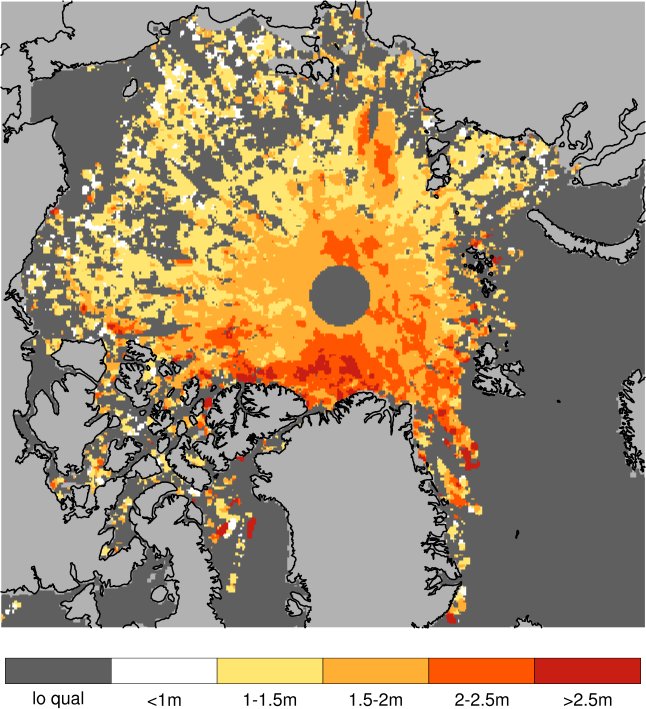
Sea ice thickness, best estimate product

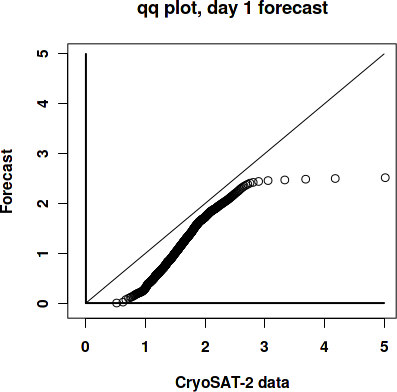
Day 1 forecast vs. observations
Contingency table
| observations | |||||||||
|---|---|---|---|---|---|---|---|---|---|
| open | c1 | c2 | c3 | c4 | c5 | c6 | |||
| m o d e l |
open | 0 | 0 | 0 | 0.001 | 0 | 0 | 0 | |
| c1 | 0 | 0.047 | 0.315 | 0.077 | 0.011 | 0.002 | 0.005 | ||
| c2 | 0 | 0.001 | 0.088 | 0.142 | 0.025 | 0.002 | 0.002 | ||
| c3 | 0 | 0 | 0.013 | 0.137 | 0.062 | 0.005 | 0.001 | ||
| c4 | 0 | 0 | 0.001 | 0.012 | 0.037 | 0.01 | 0 | ||
| c5 | 0 | 0 | 0 | 0 | 0.001 | 0.002 | 0 | ||
| c6 | 0 | 0 | 0 | 0 | 0 | 0 | 0 | ||
See category definitions for details.
Statistical distribution
|

|
Sea ice thickness, day 1 forecast
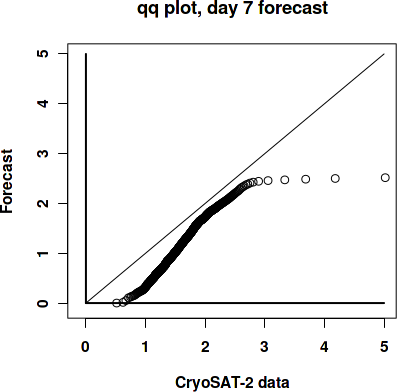
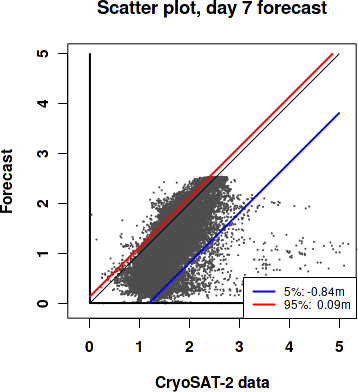
Day 7 forecast vs. observations
Contingency table
| observations | |||||||||
|---|---|---|---|---|---|---|---|---|---|
| open | c1 | c2 | c3 | c4 | c5 | c6 | |||
| m o d e l |
open | 0 | 0 | 0 | 0.001 | 0 | 0 | 0 | |
| c1 | 0 | 0.047 | 0.31 | 0.075 | 0.011 | 0.002 | 0.005 | ||
| c2 | 0 | 0.001 | 0.093 | 0.143 | 0.025 | 0.002 | 0.002 | ||
| c3 | 0 | 0 | 0.013 | 0.138 | 0.061 | 0.005 | 0.001 | ||
| c4 | 0 | 0 | 0.001 | 0.012 | 0.037 | 0.01 | 0 | ||
| c5 | 0 | 0 | 0 | 0 | 0.002 | 0.002 | 0 | ||
| c6 | 0 | 0 | 0 | 0 | 0 | 0 | 0 | ||
See category definitions for details.
Statistical distribution
|
|
Sea ice thickness, day 7 forecast

Generated by /metno/routine/sms/V2/SIthickness/c2iceWebPage.sh Fri 15 Dec 2023 02:05:26 AM UTC on arcval