Validation of ice thickness - Full domain
Bulletin date: 2019-05-30
Model: ARC MFC - TOPAZ
Data source: UCL CryoSAT-2 sea ice thickness
Validation statistics summary
| Bias (m) | RMS (m) | total grids | low SIT | OK SIT | high SIT | |
|---|---|---|---|---|---|---|
| Best estimate | -1.11 | 1.26 | 12557 | 5956 | 6544 | 57 |
| Day 1 forecast | -1.1 | 1.26 | 12557 | 5945 | 6555 | 57 |
| Day 4 forecast | -1.1 | 1.25 | 12557 | 5923 | 6577 | 57 |
| Day 7 forecast | -1.11 | 1.26 | 12557 | 5967 | 6533 | 57 |
| Day 10 forecast | -1.11 | 1.26 | 12557 | 6002 | 6497 | 58 |
Numbers in the three rightmost columns are grid counts. Regions with high/low sea ice thickness correspond to areas with model offsets from the gridded observations outside of one standard deviation. (Standard deviations are provided in the observational product.)
Definition of categories:
| Category | Sea ice thickness |
|---|---|
| c1 | <1m |
| c2 | 1 - 1.5m |
| c3 | 1.5 - 2m |
| c4 | 2 - 2.5m |
| c5 | 2.5 - 3m |
| c6 | >3m |
Best estimate vs. observations
Contingency table
| observations | |||||||||
|---|---|---|---|---|---|---|---|---|---|
| open | c1 | c2 | c3 | c4 | c5 | c6 | |||
| m o d e l |
open | 0 | 0 | 0 | 0 | 0 | 0 | 0 | |
| c1 | 0 | 0.002 | 0.023 | 0.052 | 0.032 | 0.007 | 0.013 | ||
| c2 | 0 | 0.002 | 0.006 | 0.041 | 0.115 | 0.067 | 0.041 | ||
| c3 | 0 | 0.002 | 0.002 | 0.017 | 0.084 | 0.152 | 0.128 | ||
| c4 | 0 | 0 | 0 | 0.003 | 0.018 | 0.052 | 0.101 | ||
| c5 | 0 | 0 | 0 | 0 | 0.002 | 0.005 | 0.026 | ||
| c6 | 0 | 0 | 0 | 0 | 0 | 0 | 0.006 | ||
See category definitions for details.
Statistical distribution
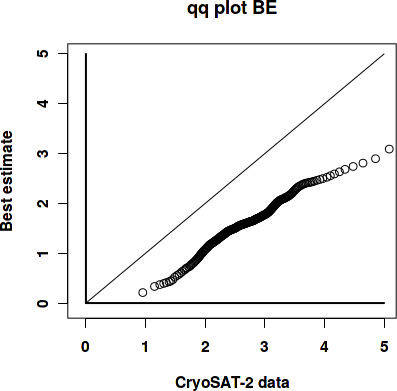
|
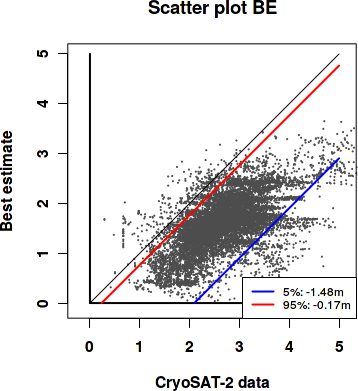
|
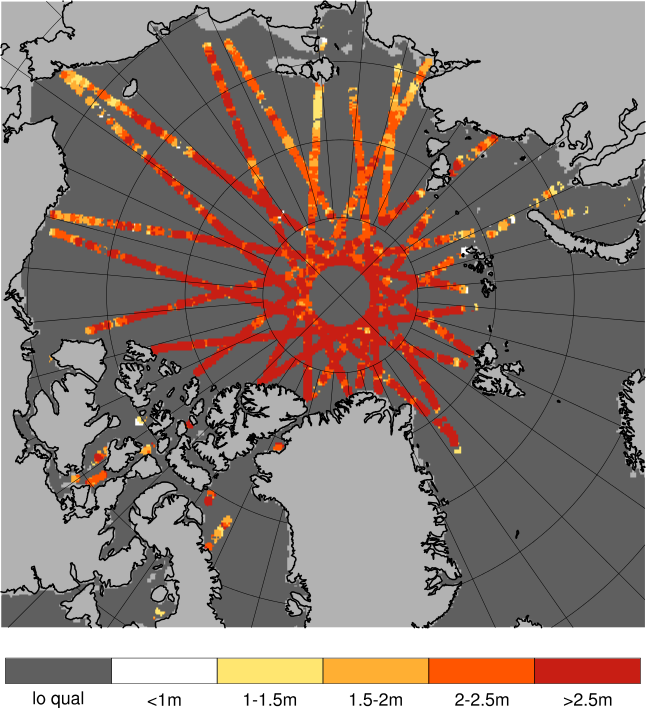
Observed sea ice thickness from CryoSAT
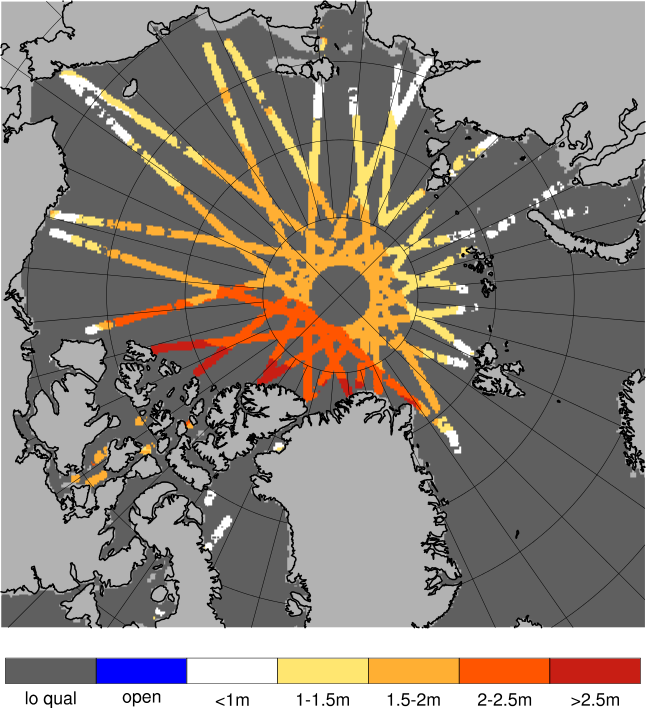
Sea ice thickness, best estimate product
Day 1 forecast vs. observations
Contingency table
| observations | |||||||||
|---|---|---|---|---|---|---|---|---|---|
| open | c1 | c2 | c3 | c4 | c5 | c6 | |||
| m o d e l |
open | 0 | 0 | 0 | 0 | 0 | 0 | 0 | |
| c1 | 0 | 0.002 | 0.023 | 0.052 | 0.031 | 0.007 | 0.013 | ||
| c2 | 0 | 0.002 | 0.007 | 0.042 | 0.117 | 0.066 | 0.04 | ||
| c3 | 0 | 0.002 | 0.002 | 0.017 | 0.084 | 0.152 | 0.128 | ||
| c4 | 0 | 0 | 0 | 0.003 | 0.018 | 0.052 | 0.101 | ||
| c5 | 0 | 0 | 0 | 0.001 | 0.002 | 0.005 | 0.026 | ||
| c6 | 0 | 0 | 0 | 0 | 0 | 0 | 0.006 | ||
See category definitions for details.
Statistical distribution
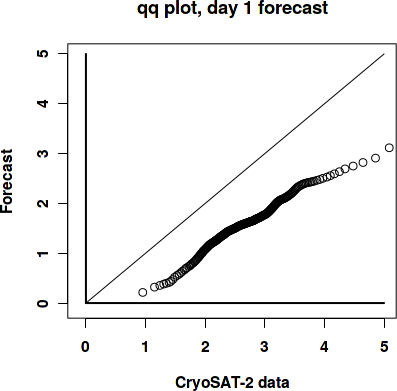
|
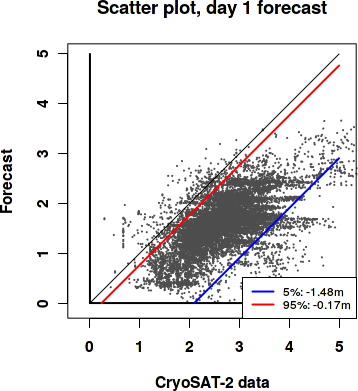
|
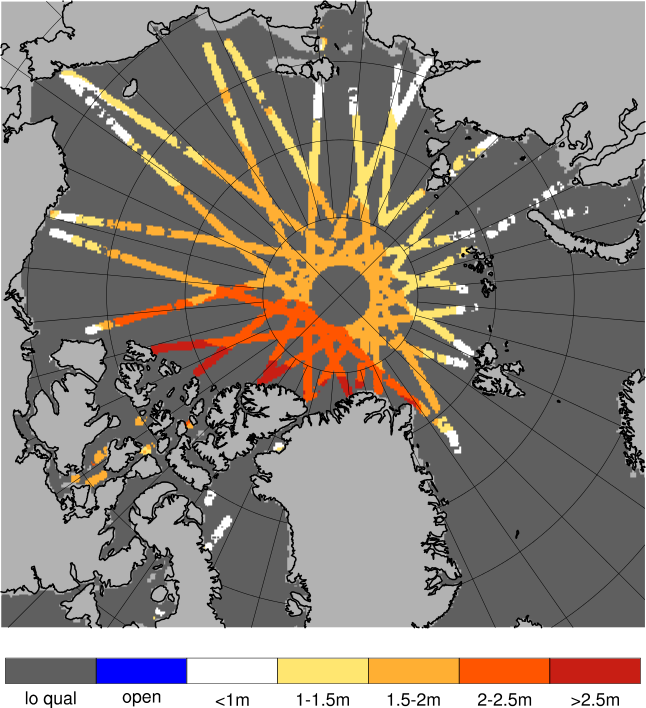
Sea ice thickness, day 1 forecast
Day 7 forecast vs. observations
Contingency table
| observations | |||||||||
|---|---|---|---|---|---|---|---|---|---|
| open | c1 | c2 | c3 | c4 | c5 | c6 | |||
| m o d e l |
open | 0 | 0 | 0 | 0 | 0 | 0 | 0 | |
| c1 | 0 | 0.002 | 0.022 | 0.052 | 0.031 | 0.007 | 0.012 | ||
| c2 | 0 | 0.002 | 0.007 | 0.041 | 0.117 | 0.066 | 0.04 | ||
| c3 | 0 | 0.002 | 0.002 | 0.017 | 0.083 | 0.151 | 0.129 | ||
| c4 | 0 | 0 | 0 | 0.003 | 0.017 | 0.052 | 0.102 | ||
| c5 | 0 | 0 | 0 | 0.001 | 0.002 | 0.005 | 0.026 | ||
| c6 | 0 | 0 | 0 | 0 | 0 | 0 | 0.006 | ||
See category definitions for details.
Statistical distribution

|

|
Sea ice thickness, day 7 forecast

Generated by /metno/routine/sms/V2/SIthickness/c2iceWebPage.sh Fri Jun 14 01:02:55 UTC 2019 on arcmfcval